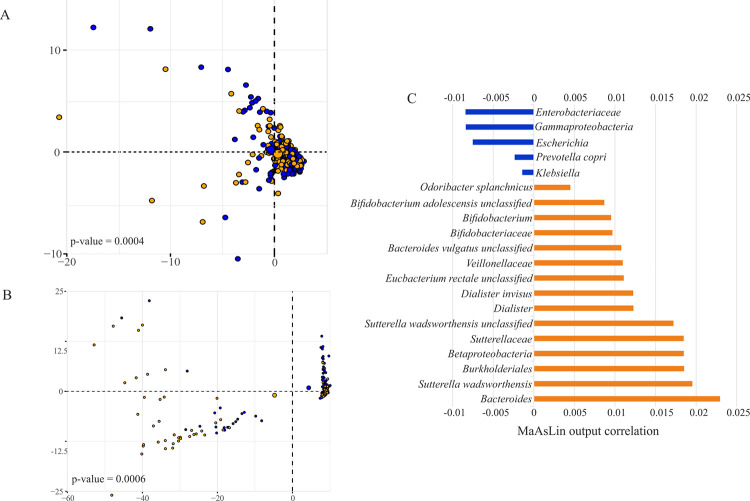
Fig 3. Distinct microbial and functional composition between age groups.
Principal component analysis of (A) microbial and (B) pathway abundances separated the two age groups above65 and below65 (PERMANOVA, 10’000 iterations). Blue color represents above65 (patients aged 65 years and above; n = 145), orange below65 (patients below 65 years of age; n = 133). (C) Correlation between taxonomic features and age (MaAsLin, q < 0.2). Positive correlations (orange) imply higher abundance in below65, whereas negative correlations (blue) imply higher abundance in above65.

