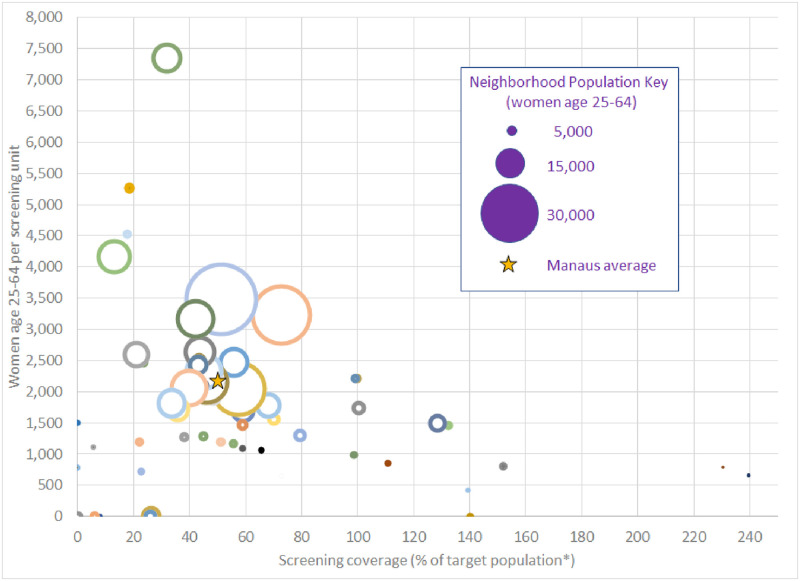
Fig 2. Female population age 25–64, screening units, coverage per residential neighborhoods in urban Manaus, Brazil, 2019.
Estimated female population is represented by size of dots. Colors are used only to distinguish screening units. Dots on the x-axis indicate neighborhoods without screening units and their population uses units from nearby neighborhoods. *Some screening units attend to women who reside outside the area, at times resulting in coverage estimates of greater than 100% (particularly for smaller units).

