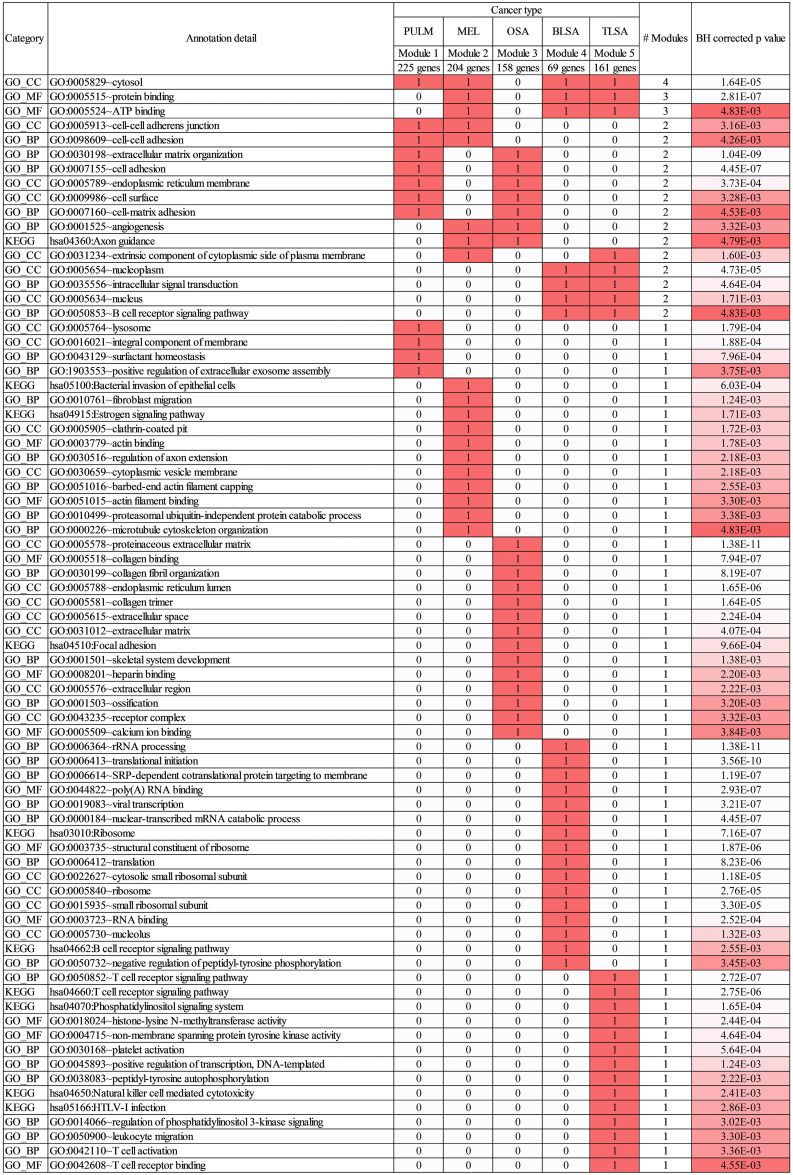
Fig 5. KEGG and GO annotations for modules and associated cancers.
Annotation matrix with rows enumerated by the different annotations and columns enumerated by cancer types and associated primary modules. Matrix elements are populated with 1 (and colored red) or 0 depending on whether the annotation is or is not associated with the module. The red color is included to highlight the block diagonal nature of the matrix. The column titled “# Modules” tallies the total number of modules that the annotations are associated with. The average BH corrected p values for these associations are given in the last column of the Table. Only p values < 0.005 are shown. P values are shaded from red to white, with the highest p values in red transitioning to the lowest p values in white. See S6 File (Tab 1) for the full set of annotations (p < 0.05).

