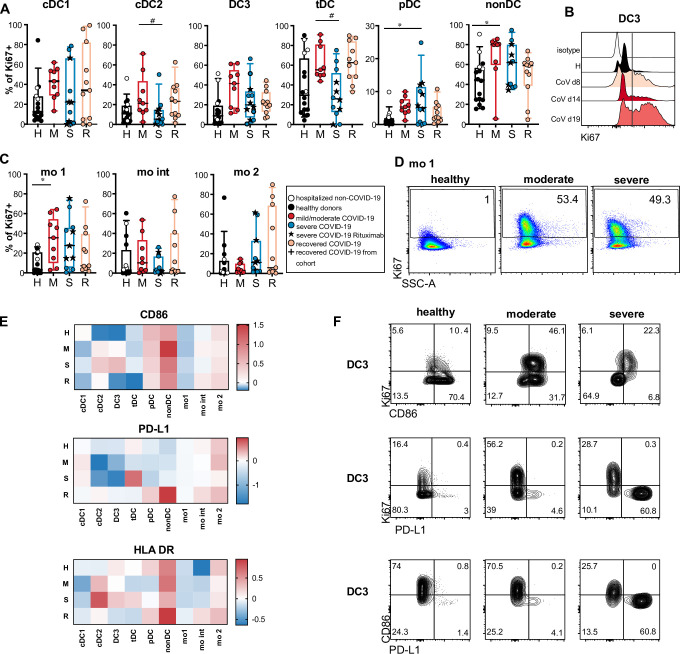
Fig 5. Increased Ki67 expression indicates enhanced turnover and delayed regeneration of DCs and monocytes.
(A) Ki67 expression in DC and monocyte subsets was analyzed by intracellular staining and flow cytometry in a subgroup of patients and controls. Healthy donors (H, black, n = 12), hospitalized COVID-19 negative patients (white symbols, n = 4), acute COVID-19 patients with mild/moderate (M, red, n = 9), severe (S, blue, n = 12) disease and recovered patients (n = 11). (A, C) Percentages of Ki67+ cells in each subset are shown (Kruskal-Wallis test with Dunn’s correction, * or # p<0.05). (B) Representative histogram of Ki67 signal in DC3 in one patient with moderate COVID-19 at different time points after diagnosis. (D) Representative results of Ki67 expression in mo 1 in one healthy, one moderate and one severe patient shown as dot plots. (E) Log2 fold changes of median MFI values of CD86, PD-L1 and HLADR in Ki67+ versus Ki67– cells within the indicated populations are shown in the heatmaps indicated by the color scale. (F) Representative results of Ki67, CD86 and PD-L1 expression in DC3 of a healthy control, and 2 COVID-19 patients with moderate and severe disease are shown.

