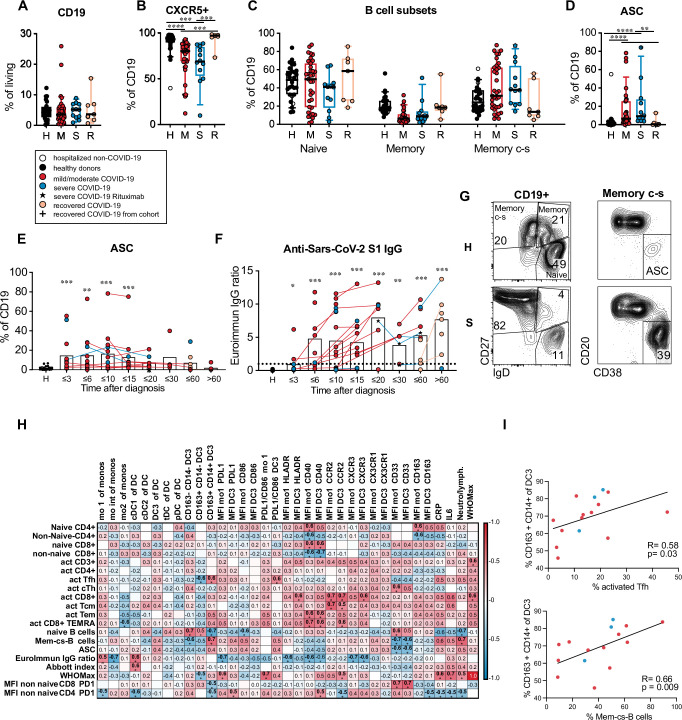
Fig 8. DC3 and monocyte phenotype correlates with Tfh and B cell activation.
(A) Frequency of CD19+ B cells within living PBMC, (B) percentage of CXCR5+ cells within the CD19+ B cells, (C) percentage of naïve and memory B cell subsets within CD19+ cells, (D) percentage of antibody-secreting cells (ASC) within CD19+ B cells in healthy/non-COVID controls (H, black/white symbols n = 24) and acute COVID-19 patients with mild/moderate (M, red, n = 35) or severe disease (S, blue, n = 13) at the first analysis timepoint and in recovered patients (R, orange, n = 7). Patients that had received B cell-depleting therapies were excluded. Kruskal-Wallis test with Dunn’s correction. (E) Frequency of ASC within CD19+ B cells (n = 102). (F) anti-SARS-CoV-2 spike S1 IgG levels (Euroimmun IgG ratio) in plasma samples (n = 105) of patients at different time points and in controls. The dotted line indicates the cutoff value for the antibody test. (E, F) Symbols indicate individual measurements (see legend in A). Connected lines represent multiple measurements of the same donor. Columns indicate the mean. Data from each grouped time point were compared with data from the control group. Kruskal-Wallis test with Dunn’s correction, *p<0.05, **p>0.01, ***p<0.001. (G) Gating strategy for B cell subpopulations and ASC. Representative results from a healthy donor and a COVID-19 patient with severe disease are shown. (H) Correlation analysis of innate parameters up to 10 days after diagnosis (horizontal) with adaptive parameters at day 10 to 25 after diagnosis (vertical) in the same patients (n = 9–17). Spearman’s rank correlation coefficients (-1 to 1) are indicated by the color scale. * adjusted p values below 0.05. (I) Correlation analysis of the percentage of CD163+ CD14+ cells within DC3 (until day 10) and the percentage of activated cells within Tfh-like cells or the percentage of class-switched memory B cells within CD19+ cells (day 10–25 after diagnosis, n = 15). Spearman’s rank correlation coefficients, p-value and linear regression lines are shown. Mem c-s B: class-switched memory B cells; ASC: antibody secreting cells; TCM: T central memory; TEM: T effector memory; TEMRA: T effector memory reexpressing CD45RA.

