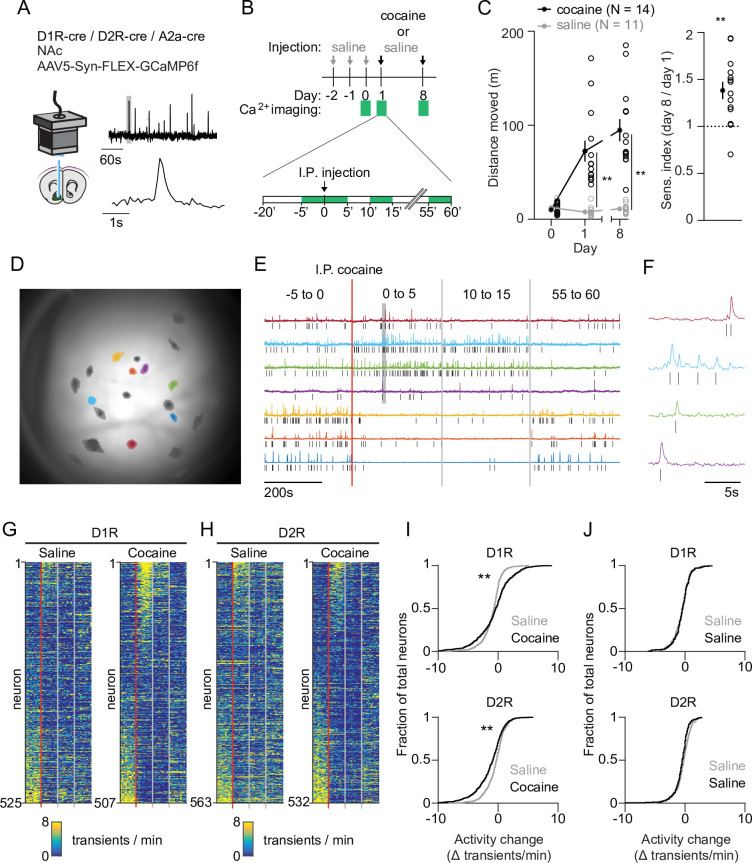
Figure 1. Acute changes in accumbal neuronal activity in response to cocaine.
(A) Schematic of calcium imaging setup. Inset graph shows calcium recording trace, gray line indicates zoomed area in lower graph. Top trace horizontal bar is 60 s, bottom trace horizontal bar is 1 s. (B) Schematic of behavioral setup. Green squares indicate recording days (top) and 5-min recording windows (bottom). (C) Left panel: distance moved 1 hr after I.P. injection in mice that either receive cocaine (N = 14) or saline control (N = 11) injections, for two sessions separated by 1 week. Average responses (mean ± S.E.M.): cocaine group: day 1: 72.5 ± 11.2 m, day 8: 94.8 ± 11.8 m. Saline group: day 1: 7.8 ± 1.6 m, day 8: 11.0 ± 1.5 m. Repeated measures ANOVA: Days x Treatment: F (2,46) = 30.74, Bonferroni-corrected post hoc T-test: ** = p < 0.01. Right panel: sensitization index in cocaine treated animals. Average response (mean ± S.E.M.): sensitization index 1.38 ± 0.09. Paired T-test: p = 1.2 x 10⁻³. ** = p < 0.01 (D) Field of view of a single animal (D1R-cre), overlaid with a subset of neurons recorded during a single cocaine-treated session. (E) Temporal trace (CNMF-E label ‘C_raw’) of highlighted neurons in panel (D), showing diverse activity responses to first cocaine injection within the same D1R-cre mouse. Raw traces are rescaled to their own maximum. Tick marks indicate detected calcium transients. (F) Zoom of highlighted area (gray box) in panel (F), showing calcium signals over time. Tick marks indicate detected calcium transients. (G) Calcium transient frequency heatmap of all neurons recorded in D1R-cre cocaine treated animals during either saline (left) or cocaine (right) treatment. Data is sorted by amplitude of change in activity. N = 7 animals. (H) Same as panel (G) but for D2R-cre cocaine treated animals. N = 7 animals. (I) Top panel: Cumulative distribution of activity change (−5 to 0 vs 0 to 5) minutes after I.P. injection in D1R neurons of the cocaine-treated groups around either saline (grey) or cocaine (black) treatment. Saline: n = 525 neurons, cocaine n = 507 neurons. Two-sample Kolmogorov–Smirnov test: p = 1.3 x 10⁻¹⁰. Bottom panel: same but for D2R neurons. Saline: n = 563 neurons, cocaine n = 532 neurons. Kolmogorov-Smirnov test: p = 1.3 x 10–07. ** = p < 0.01 (J) Top panel: cumulative distribution of activity change (−5 to 0 vs. 0 to 5 min around I.P. injection) in D1R neurons of control animals treated only with saline on 2 separate days. First saline: n = 273 neurons, second saline: n = 235 neurons. Kolmogorov-Smirnov test: p = 1. Bottom panel: same but for D2R neurons. First saline: n = 231 neurons, second saline: n = 256 neurons. Kolmogorov-Smirnov test: p = 0.054. Kolmogorov-Smirnov tests are corrected for multiple comparisons.


