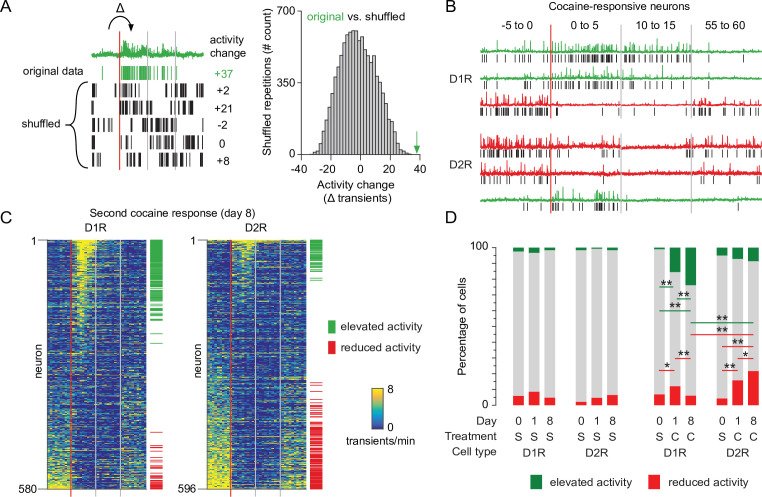
Figure 2. Recruitment of cocaine-responsive neurons during cocaine sensitization.
(A) Schematic overview of methodology to identify responsive neurons. Calcium transients are detected from traces (green trace shows raw trace, green ticks show calcium transients), and activity change around cocaine injection is compared to shuffled sequences of the same inter-transient intervals (bottom left and histogram). Vertical lines indicate edges of five-minute recording windows, red line indicates cocaine injection. Green arrow indicates non-shuffled result. (B) Calcium traces of example D1R (top three) or D2R (bottom three) neurons that either show significant increased (green) or decreased (red) activity to cocaine. Vertical red line indicates cocaine injection moment, red and gray lines indicate edges of recording periods. Black ticks indicate detected calcium transients. (C) Calcium transient frequency heatmap of all neurons recorded around second cocaine injection in either D1R-cre mice (left, n = 580 neurons from seven animals) or D2R-cre mice (right, n = 596 neurons from seven animals). Neurons are sorted by their response to cocaine, green and red ticks indicate significantly responsive neurons. (D) Fraction of responsive neurons among D1R-cre and D2R-cre neurons in saline control or cocaine-treated animals. S = saline. C = cocaine. D1R control n = 273/235/229 neurons (day 0 /day 1 /day 8) from 6 mice. D2R control n = 231/256/231 neurons from 5 mice. D1R cocaine n = 525/507/580 neurons from 7 mice. D2R cocaine n = 563/532/596 neurons from 7 mice. Fishers Exact test: D1R cocaine group, elevated activity: day 0 vs day 1: p = 5.9 x 10⁻¹⁹, day 1 vs day 8: p = 1.9 x 10⁻³, day 0 vs day 8: 1.5 × 10⁻³⁴. Reduced activity: day 0 vs day 1: p = 1.6 x 10⁻², day 1 vs day 8: p = 1.7 x 10⁻³. D2R cocaine group reduced activity: day 0 vs day 1: p = 3.1 x 10⁻¹⁰. day 1 vs day 8: p = 4.4 x 10⁻². Day 0 vs day 8: p = 3.4 x 10⁻¹⁹. All other intra-group comparisons p > 0.05. Day 8 cocaine, D1R vs D2R: elevated activity, p = 9.0 x 10⁻¹³, reduced activity, p = 4.1 x 10⁻¹⁵. * = p < 0.05, ** = p < 0.01.


