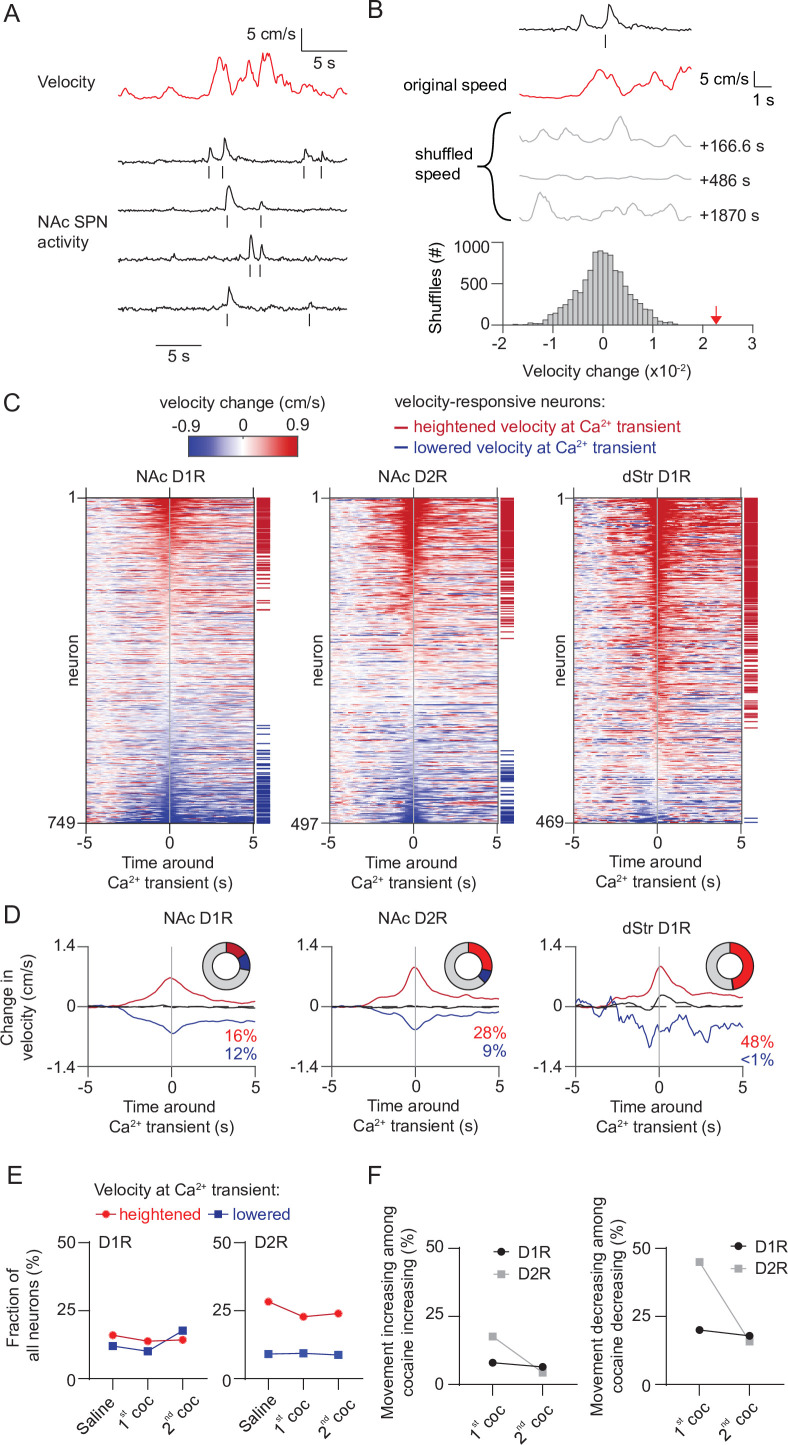
Figure 4. Movement-related activity of NAc neurons does not change during cocaine sensitization.
(A) Example trace showing velocity over time and the activity of D1R neurons recorded during a saline-treated session. Ticks below each trace indicate detected calcium transients. (B) Schematic overview of methodology to identify neurons correlated to velocity. Calcium transients are detected from traces and velocity change around each transient is computed, and then averaged per neuron. Alignment is then compared to temporally shifted shuffled data (where the velocity is offset by a random time period) to identify movement-correlating neurons (see Materials and methods). Gray lines indicate examples of temporally shifted data, and histogram shows distribution of this data. Red arrow indicates non-shuffled result. (C) Heatplot showing average velocity change aligned to calcium transients in either NAc D1R neurons (left), NAc D2R neurons (middle) or dStr D1R neurons (right) under saline injection conditions. Neurons are sorted by their movement response amplitude. Horizontal red and blue lines indicate significantly velocity-responsive neurons. (D) Average activity over time of neurons correlated with either heightened (red), non-significant (black) or lowered (blue) movement at the time of the calcium transient under saline conditions. Pie chart insets shows fraction of total neurons with significant response. (E) Fraction of neurons correlated to movement over days. (F) Left: fraction of neurons correlated to increases of movement among cocaine-responsive neurons with elevated activity. Right: fraction of neurons correlated to decreases of movement among cocaine-responsive neurons with reduced activity.
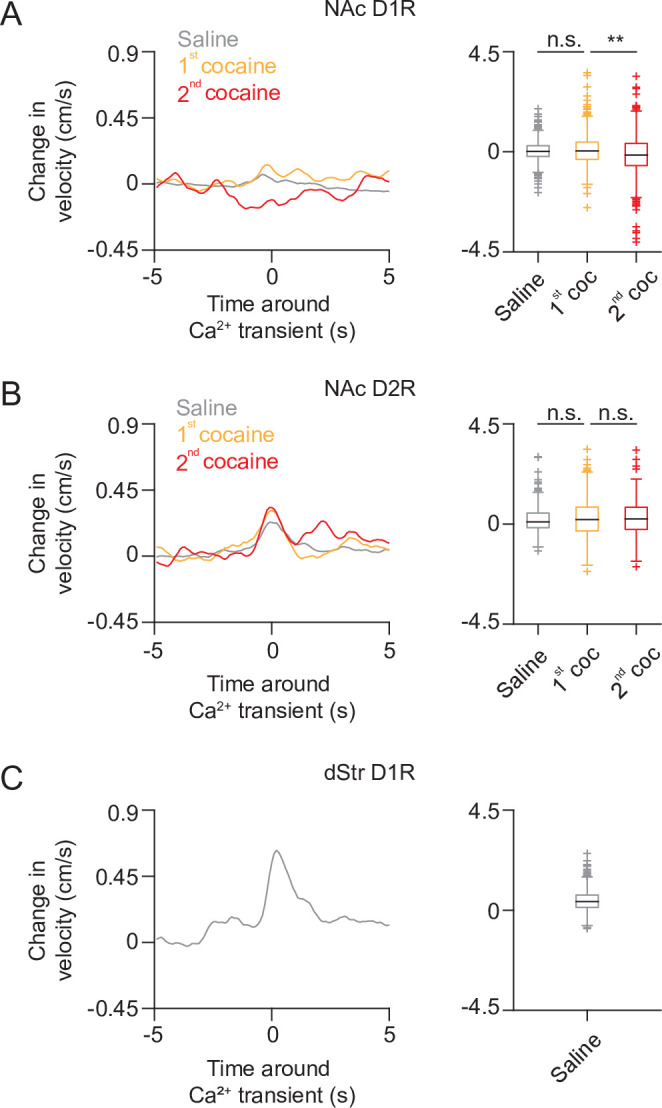
Figure 4—figure supplement 1. Movement around calcium transients in all recorded neurons over days.


