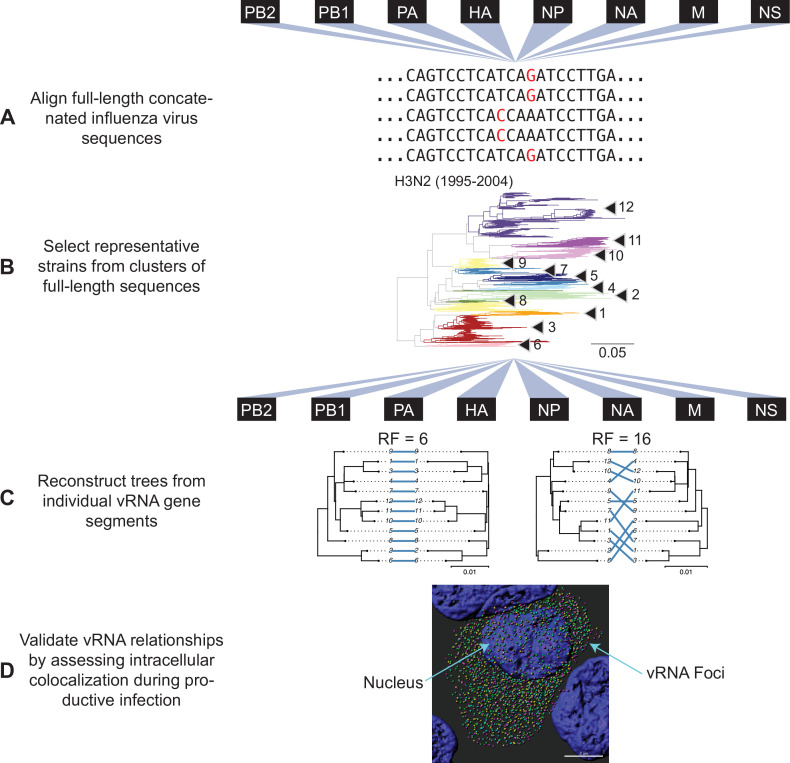
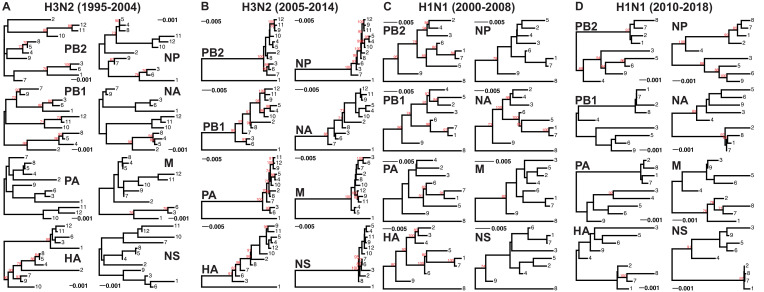
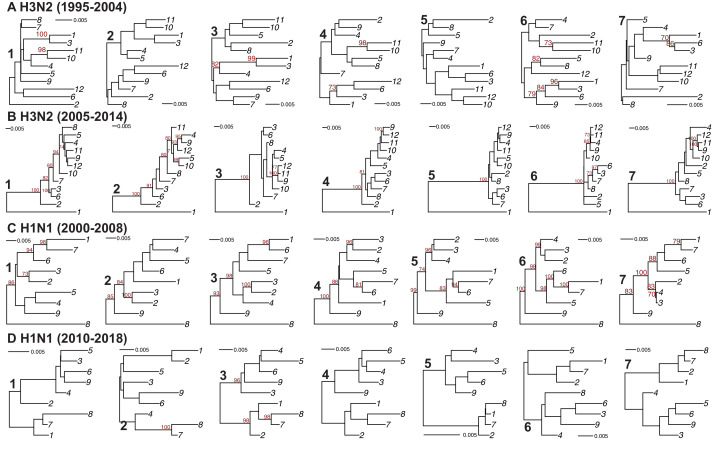
Figure 1. Experimental overview.
(A) Human H3N2 or H1N1 virus sequences were downloaded from the Influenza Research Database and subset into two time periods each: 1995 to 2004 and 2005 to 2014 (H3N2 viruses); 2000 to 2008 and 2010 to 2018 (H1N1 viruses). The H3N2 virus dataset (1995 to 2004) is illustrated here. All eight viral RNA (vRNA) segments from each strain were concatenated into a full-length genome from which alignments were made. (B) A species tree was built clustering strains into operational taxonomic unit with at least 97% sequence identity. Arrowheads denote clusters 1–12. Seven replicate strains were randomly selected from each cluster for further analysis. (C) Full-length genomic sequences were partitioned into individual vRNA gene sequence alignments and maximum-likelihood phylogenetic trees were reconstructed from each vRNA gene segment in each replicate. Tree similarity was determined by the Robinson-Foulds distance (RF) and clustering information distance (CID) in each pair of trees. Left, a pair of highly similar trees with a low tree distance plotted in a tanglegram (e.g. back-to-back trees), with intersecting blue lines matching tips. Right, a tanglegram of a pair of dissimilar trees with a high tree distance. Scale bars indicate substitutions per site. (D) Colocalization of vRNA segments exhibiting high and low tree similarity were assessed by fluorescence in situ hybridization (FISH). Cells were infected with viruses representative of those analyzed in (A–C) and fixed and stained with FISH probes specific for vRNA segments of interest. Cells were imaged using confocal microscopy and colocalization between vRNA segments was quantified.


