. 2021 Aug 27;10:e66525. doi: 10.7554/eLife.66525

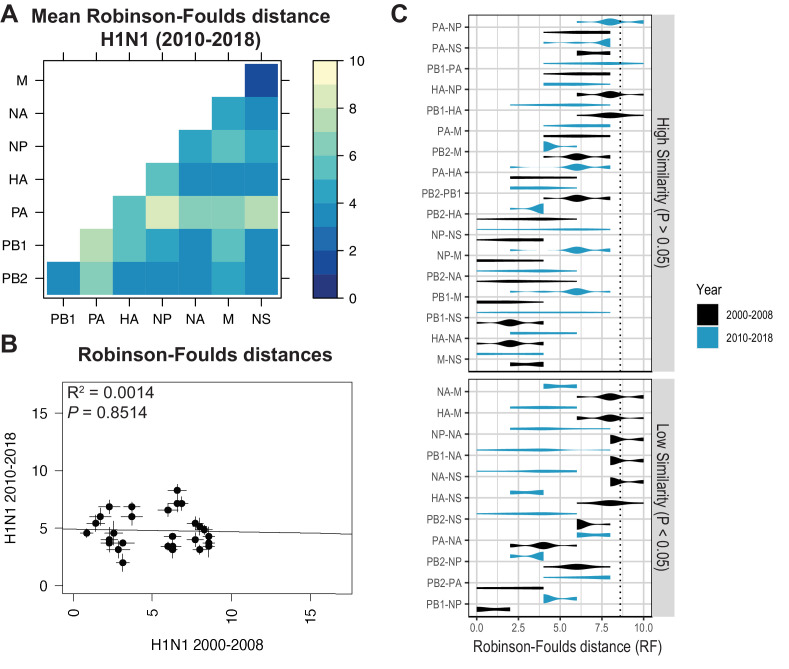
Figure 5. Parallel evolution between viral RNA (vRNA) segments diverges in antigenically shifted H1N1 viruses.

(A) Seven replicate maximum-likelihood trees were reconstructed for each vRNA gene segment from human H1N1 virus sequences from 2010 to 2018 as described in Figure 1. The pairwise Robinson-Foulds distance (RF) between trees was calculated for each set of replicate trees. Mean tree distances were visualized in a heatmap. Refer to Figure 5—figure supplement 1 for the standard error of the mean (SEM) of each pair. (B) Mean RF of replicate trees from H1N1 viruses from 2000 to 2008 were plotted against those from 2010 to 2018. The line of best fit was determined by linear regression (solid line). The R2 and p-value are indicated. Error bars indicate the SEM of all replicates. (C) Replicate RF were plotted comparing H1N1 viruses from 2000 to 2008 (black) to H1N1 viruses from 2010 to 2018 (turquoise). ‘Low similarity’ pairs are grouped where p < 0.05 (Mann-Whitney U test with Benjamini-Hochberg correction; exact p-values reported in Supplementary file 6). Dashed line, 95% confidence interval for tree similarity (determined by a null dataset; refer to Figure 2—figure supplement 3).

Figure 5—source data 1. Mean Robinson-Foulds distance (RF) of pairwise replicate tree comparisons of H1N1 viruses from 2010 to 2018 (corresponding to Figure 5A).
Figure 5—source data 2. Pairwise Robinson-Foulds distance (RF) for each replicate tree from H1N1 viruses from 2000 to 2008 or 2010 to 2018, as indicated (corresponding to Figure 5B and C).

Figure 5.

Figure 5—figure supplement 1. The standard error of the mean (SEM) of replicate Robinson-Foulds distances (RF).
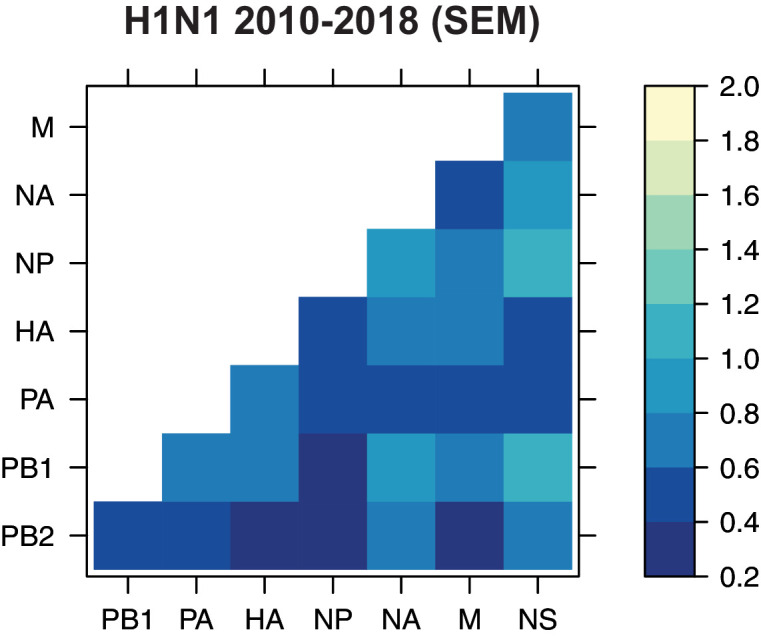
Figure 5—figure supplement 1.

The SEM of all pairwise RF was determined for H1N1 viruses from 2010 to 2018 (corresponding to the mean tree distances from Figure 5A).
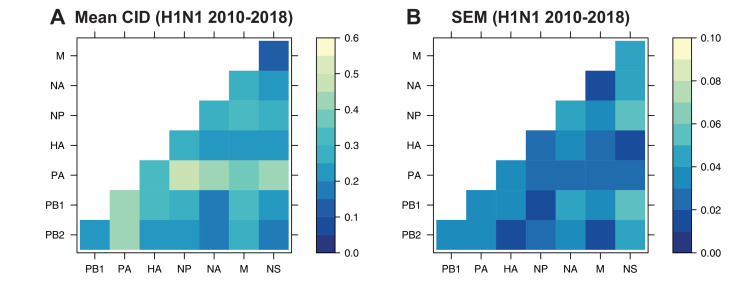
Figure 5—figure supplement 2. The mean clustering information distance (CID) of replicate viral RNA (vRNA) trees.

Figure 5—figure supplement 2.

The pairwise CID was calculated between each replicate vRNA tree from human H1N1 viruses from 2010 to 2018. The mean CID (A) and standard error of the mean (SEM) of all pairwise CID (B) were visualized in a heatmap.
Figure 5—figure supplement 2—source data 1. Pairwise clustering information distance (CID) for each replicate tree from H1N1 viruses from 2010 to 2018.
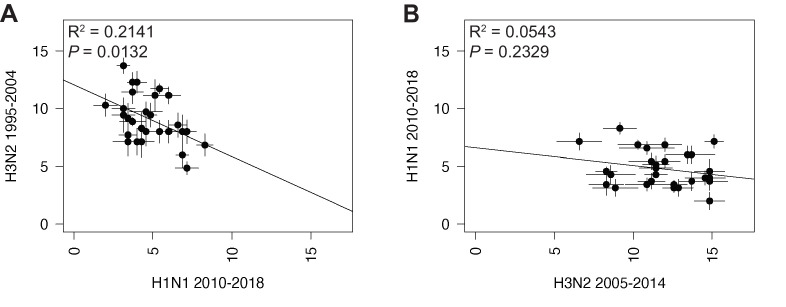
Figure 5—figure supplement 3. Linear regression of tree distances determined by Robinson-Foulds distance (RF).

Figure 5—figure supplement 3.

Mean RF of replicate trees from H1N1 viruses from 2010 to 2018 were plotted against those from H3N2 viruses from 1995 to 2004 (A) and H3N2 viruses from 2005 to 2014 (B). The line of best fit was determined by linear regression (solid line). The R2 and p-value are indicated. Error bars indicate the standard error of the mean (SEM) of all replicates.
Figure 5—figure supplement 4. Linear regression of tree distances determined by clustering information distances (CID).

Figure 5—figure supplement 4.

Mean CID values of replicate trees from H1N1 viruses from 2010 to 2018 were plotted against those from H3N2 viruses from 1995 to 2004 (A), H3N2 viruses from 2005 to 2014 (B), or H1N1 viruses from 2000 to 2008 (C). The line of best fit was determined by linear regression (solid line). The R2 and p-value are indicated. Error bars indicate the standard error of the mean (SEM) of all replicates.
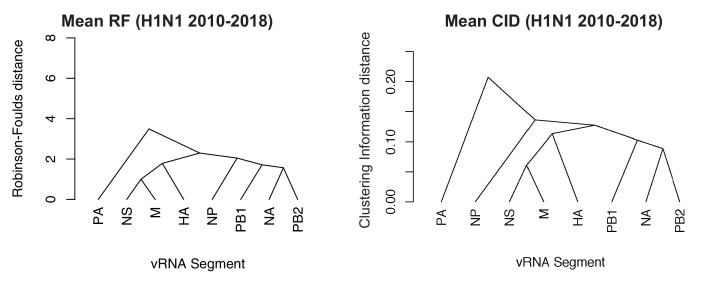
Figure 5—figure supplement 5. Networks determined from pairwise tree distances.

Figure 5—figure supplement 5.

Overall viral RNA (vRNA) relationships corresponding to H1N1 viruses from 2010 to 2018 were assessed with UPGMA trees derived from the mean Robinson-Foulds distance (RF) corresponding to Figure 5A (A) or the clustering information distance (CID) corresponding to Figure 5—figure supplement 2A (B). Scale bar corresponds to either RF or CID. The point at which edges merge is equivalent to 1/2 RF or 1/2 CID.