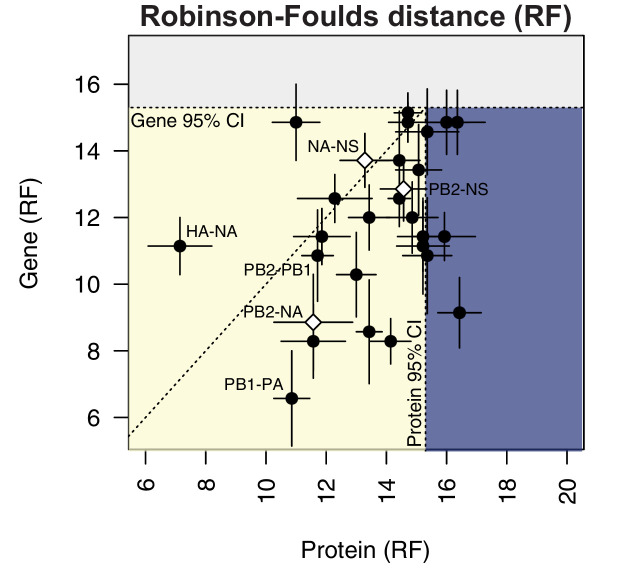
Figure 6. Protein-coding substitutions do not fully account for parallel evolution between genes.
H3N2 virus viral RNA (vRNA) gene sequence alignments from 2005 to 2014 were translated into the corresponding amino acid alignments. Neighbor-joining trees were reconstructed from these alignments and the Robinson-Foulds distance (RF) was tabulated for all protein tree pairs. The mean tree distance of each pair of protein trees was plotted against the mean tree distance of the corresponding gene trees. For the M and NS gene segments, which encode multiple protein products, tree distances were calculated for each protein tree individually and the average distances are shown. Error bars indicate the standard error of the mean (SEM) of replicate trees. Dashed horizontal and vertical lines, 95% confidence interval (CI) for tree similarity, as determined by a null dataset (refer to Figure 2—figure supplement 3). The region shaded yellow lies within the 95% CI for both gene and protein trees with the identity line plotted. The region shaded blue lies within the 95% CI for gene trees but not protein trees. The region shaded gray lies outside the 95% CI for both gene and protein trees.
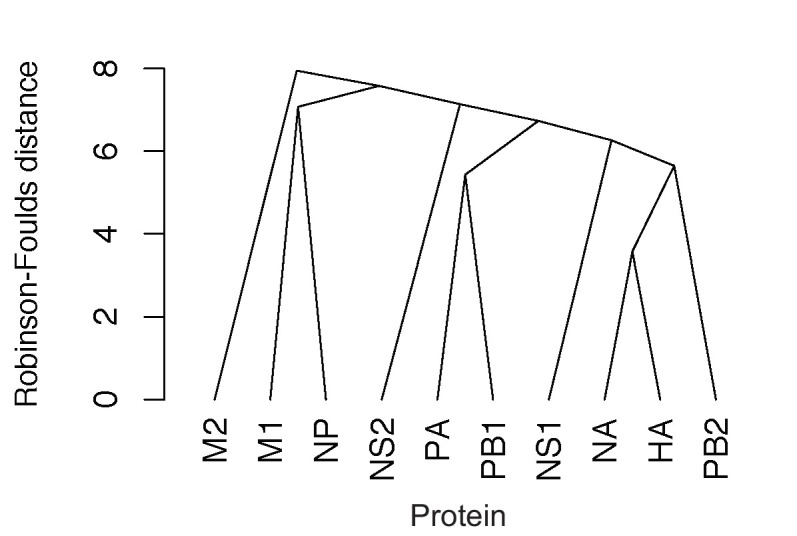
Figure 6—figure supplement 1. Parallel evolution between proteins in H3N2 viruses from 2005 to 2014.


