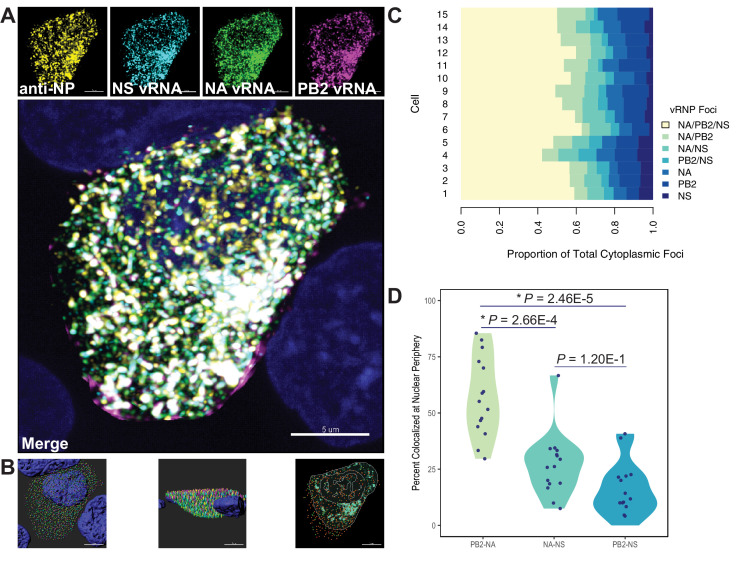
Figure 7. Colocalization of viral RNA (vRNA) segments at the nuclear periphery correlates with evolutionary relationships during productive viral infection.
A549 cells were infected with A/Perth/16/2009 (H3N2) at a multiplicity of infection (MOI) of 2 or mock-infected. Cells were fixed at 8 hr post-infection and combination fluorescence in situ hybridization/immunofluorescence (FISH and IF, respectively) was performed. FISH probes targeting the NS, NA, and PB2 vRNA segments were labeled with Alexa Fluor 488, Quasar 570, and Quasar 670, respectively. Antibodies targeting nucleoprotein (NP) were used with an anti-mouse Alexa Fluor 594 secondary antibody. Nuclei were labeled with DAPI. Coverslips were mounted and volumetric imaging was performed to obtain Nyquist sampling. (A) A maximum projection image of a representative cell is shown after cell segmentation. Scale bar corresponds to 5 µm. (B) A 3D rendering of the cell after analysis. (C) Colocalization of vRNA segments was assessed in 15 individual infected cells. (D) Quantification of each pair of vRNA segments within 300 nm of the nuclear border. Each point represents an individual cell (n = 15). Aggregate data from three independently performed experiments are shown. Asterisks (*) indicate p-adj < 0.05 (Mann-Whitney U test with Benjamini-Hochberg correction).

