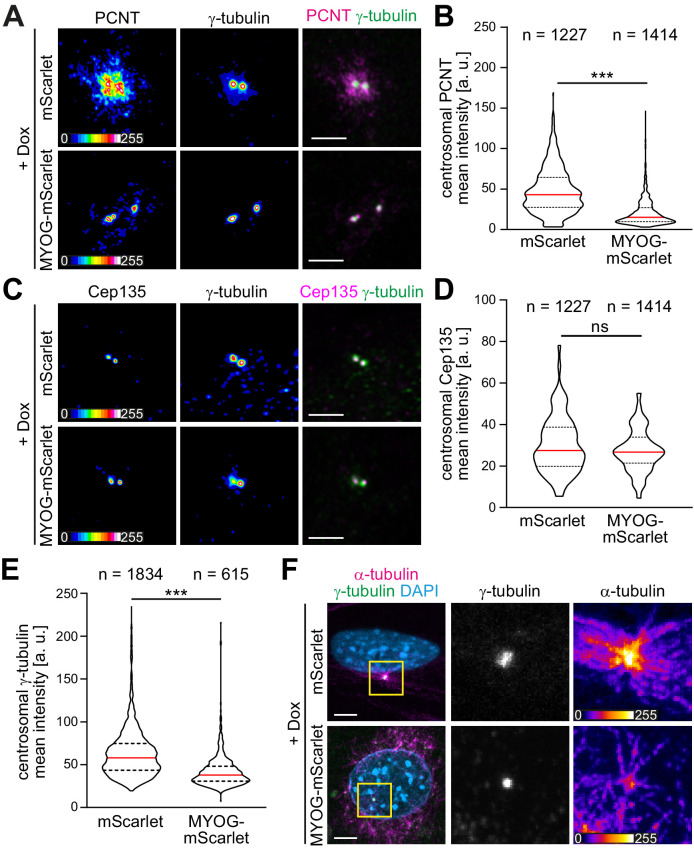
Figure 3. Myogenin expression attenuates the centrosomal microtubule-organizing center (MTOC).
(A–E) mScarlet or MYOG-mScarlet cells were stimulated with doxycycline (Dox) for 3 days and PCNT (A), Cep135 (C), and γ-tubulin (A, C) were detected by immunostaining. Quantification shows that PCNT (B) and γ-tubulin (E) intensities at the centrosome are reduced upon myogenin induction while Cep135 intensity (D) is not significantly affected. Single-channel images of Pcnt, γ-tubulin, and Cep135 are false-colored to visualize different intensities. Data are shown as violin plots. The red line indicates the median, and dotted lines indicate the 25% and 75% percentile. ns: p>0.05; ***p<0.001. Scale bars = 5 µm. N numbers indicate the total number of analyzed centrioles (y-tubulin foci) pooled from four biological replicates. (F) Immunostaining of α-tubulin and γ-tubulin in Dox-stimulated mScarlet or MYOG-mScarlet cells after 30 s of microtubule regrowth. Intensity-based color coding of α-tubulin shows that microtubule growth from centrioles is reduced after myogenin induction. Scale bars: 5 µm.

