. 2021 Oct 18;10:e71811. doi: 10.7554/eLife.71811

Figure 1. Summary of experimental set-up and broad patterns of invader survival across the three sampling points.

Figure 1.

(A) Schematic depicting the sampling and processing of communities (field sampling and growth of lab acclimation of communities), the cryopreservation and sequencing of the lab-acclimated communities, and the setup and sampling scheme of the laboratory experiment described here. (B) Invader survival values for both invaders at each of the three sampling points in monoculture (diamonds) and in communities (circles). Larger, white points represent the means for the respective subsets of the data; grey line represents the estimated cells/ml detection limit; dashed line represent inferred trajectories between the inoculation density and the invasion densities, as the inoculation density was measured in the invader culture prior to its inoculation into communities.

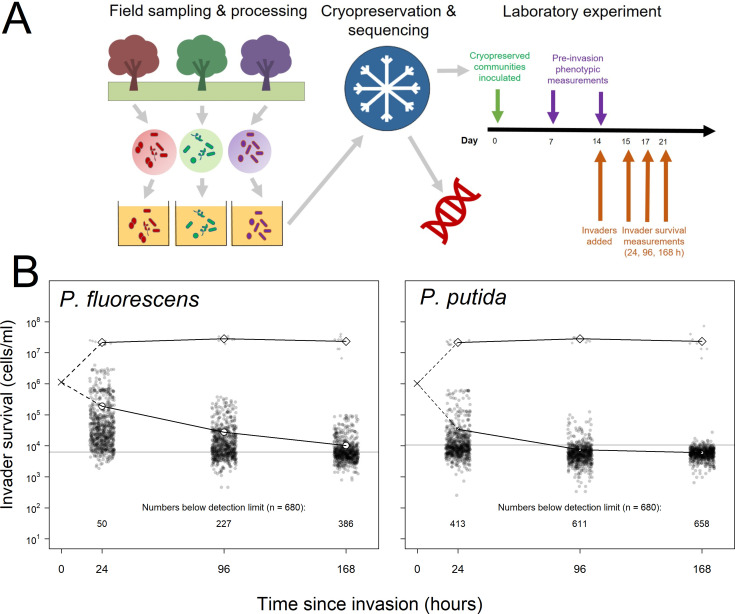
Figure 1—source data 1. Invader survival data for each of the 680 communities after averaging across the four pseudoreplicated assays and converting from lux to cells/ml.
The invader survival data columns are labelled in the format ‘invader identity.cell density per ml.hours since invasion’.
Figure 1—source data 2. Data from the growth-curve assay of luminescence and plate count measurements, used to calibrate invader luminescence against cell density.
Key columns are invader (invader assayed – P. fluorescens SBW25 or P. putida KT2440), rep (replicate), the cfu.00 columns (cells per ml at n hours of growth) and the lum.00 columns (lux at n hours of growth).
Figure 1—source data 3. Table in the same format as as Figure 1—source data 1 but with TRUE/FALSE values instead of values indicating which invader survival measurements were below the detection limit of 12 lumens (TRUE) before conversion to cells/ml.