. 2021 Oct 18;10:e71811. doi: 10.7554/eLife.71811

Figure 2. Comparison of total variance explained (top bars) and the variable importance values (bottom heatmap) of the six random forests, computed for each of the two invaders and each of three the invader survival sampling points at 24, 96, and 168 hr post-invasion.

Total variance explained is calculated as pseudo R-squared: 1-Mean Squared Error/variance (invader survival) of the random forest. Variable importance values are the percentage increase in Mean Squared Error (IncMSE %) when the variable is not permuted i.e. a high (low) value represents a variable of high (low) importance to explaining invasion success. Each column in the variable importance heatmap represents the variable importance values of the random forest using functional Groups represented by the orange bar in the top figure. The heatmap is split into compositional (above split) and functional (below split) variables. Compositional variables labelled 'FG+number' refer to the functional group ids.

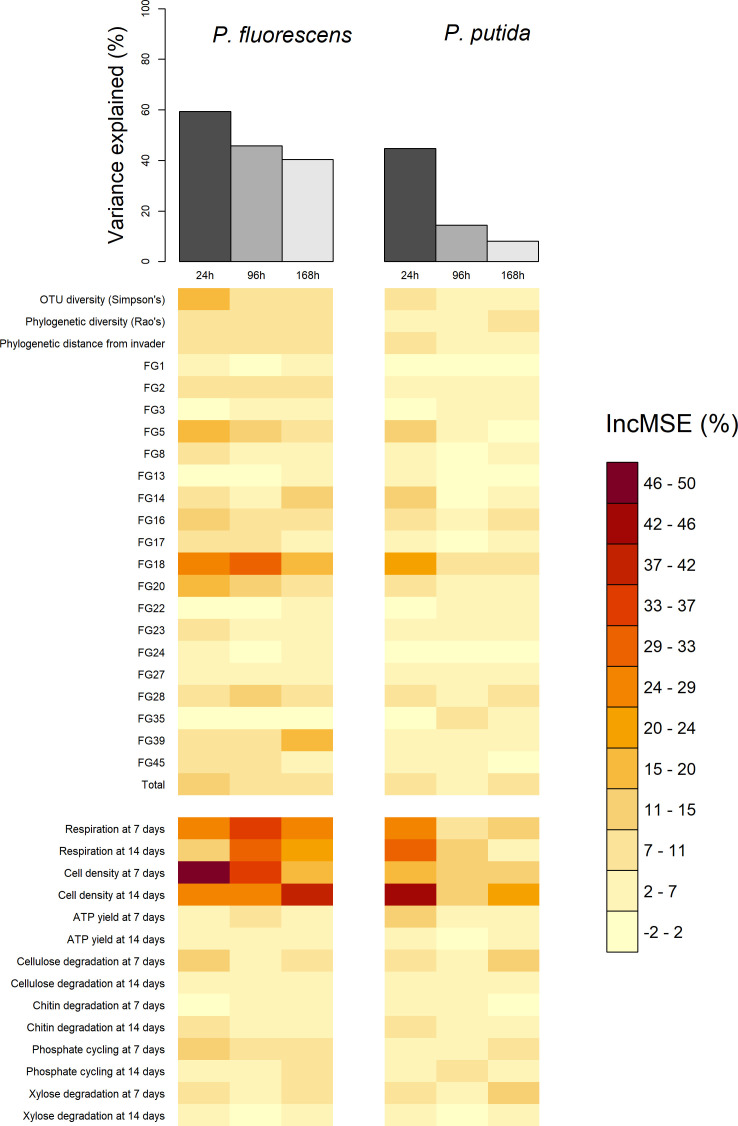
Figure 2—source data 1. Table of the variance explained by each random forest with key columns being invader (invader assayed – P. fluorescens SBW25 or P. putida KT2440), timepoint (time since invasion), and varexp (pseudo R-squared/% variance explained).
Figure 2—source data 2. Invader survival data for each of the 680 communities after averaging across the four pseudoreplicated assays and converting from lux to cells/ml.
The invader survival data columns are labelled in the format ‘invader identity.cell density per ml.hours since invasion’.

Figure 2.

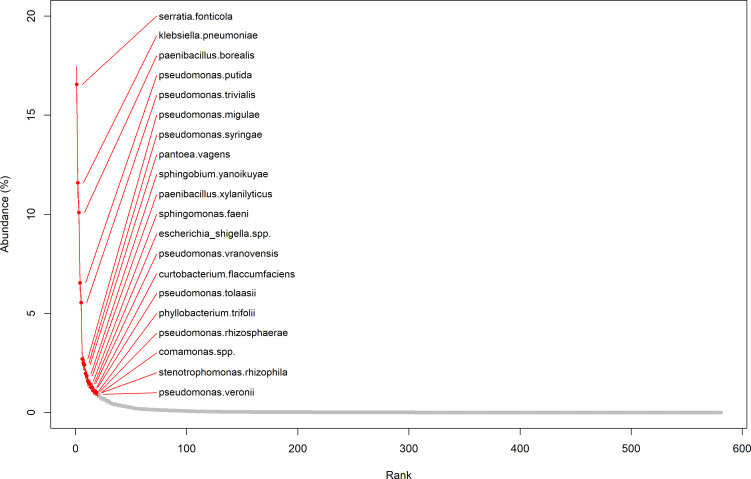
Figure 2—figure supplement 1. Rank abundance plot of OTUs (mean and standard error of each OTU’s abundance in all communities).

Figure 2—figure supplement 1.

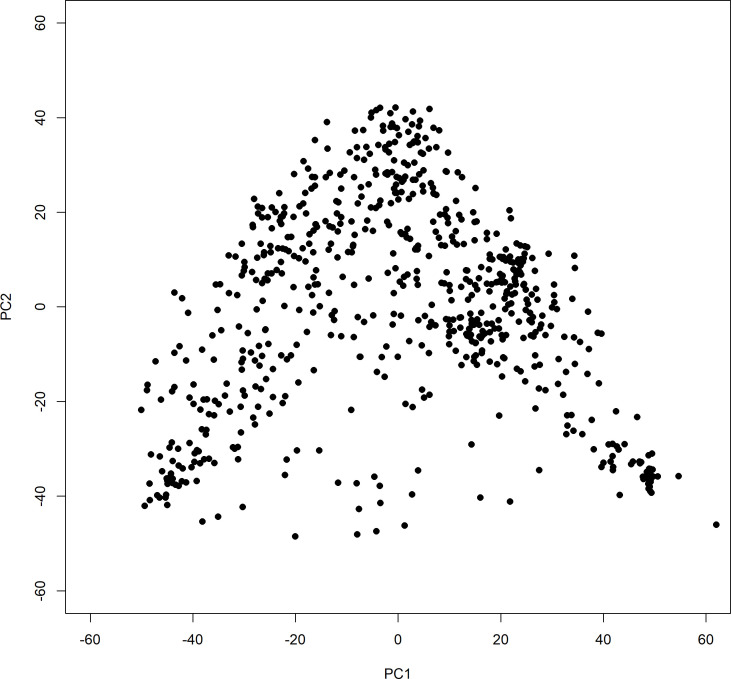
Figure 2—figure supplement 2. First two coordinates (of five total used in the analysis) of the principal coordinates analysis (PCoA).

Figure 2—figure supplement 2.

The PCoA was performed on the distance matrix of the Jensen-Shannon divergence (Endres and Schindelin, 2003) of OTU abundances using the ‘dudi.pcoa’ function from the ade4 package (Chessel et al., 2004).
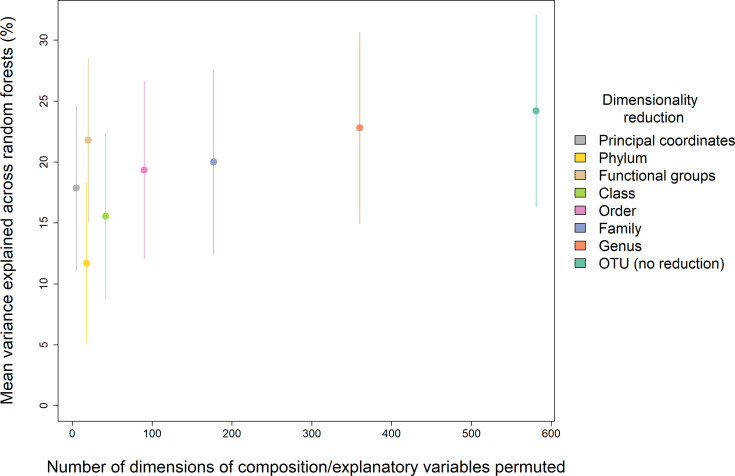
Figure 2—figure supplement 3. Comparison of the performance of different dimensionality reductions of the starting composition data, shown as mean variance explained vs the number of dimensions in each of the tested reductions. The functional groups approach had a disproportionate explanatory power for its number of dimensions, comparable to no dimensionality reduction, and so we opted for this method for our main analyses.

Figure 2—figure supplement 3.