. 2021 Oct 18;10:e71811. doi: 10.7554/eLife.71811

Figure 3. Selected strong (top) and weak (bottom) relationships between explanatory variables and P. fluorescens invasion success at 24 hr post-invasion.

Colours represent the mean abundance of OTUs belong to Functional Group 18 in each community (blue low, red high).

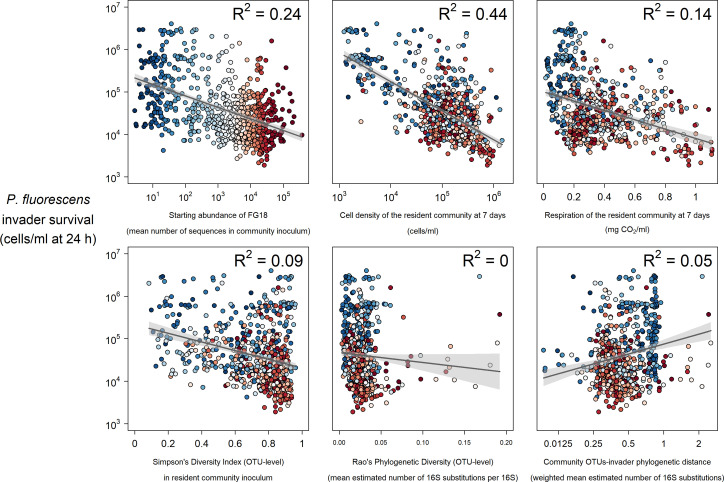
Figure 3—source data 1. Invader survival data for each of the 680 communities after averaging across the four pseudoreplicated assays and converting from lux to cells/ml.
The invader survival data columns are labelled in the format ‘invader identity.cell density per ml.hours since invasion’.
Figure 3—source data 2. Diversity metrics for each of the 680 communities (Simpson’s diversity, Rao’s quadratic entropy, and phylogenetic distance of the invader from the community for each of the two invaders).
Figure 3—source data 3. Abundance of each of the functional groups in each of the 680 communities (mean number of sequences in the community inoculum for OTUs belonging to that group).
Figure 3—source data 4. Data relating to the phenotypic assays performed/measurements taken at 7 and 14 days, before invasion at 14 days.
Key column types are mgCO2 (milligrams of CO2 produced), CPM (cells per ml), ATP activity (nM ATP/ml), mG (mg/ml glucosidase), mN (mg/ml chitnase), mX (mg/ml xylosidase), mP (mg/ml phosphatase). Numbers in these column titles represent the day (7 or 14) when the measurement was taken.
Figure 3—source data 5. Diversity and phenotypic assay data, combined into one table for convenience.

Figure 3.

Figure 3—figure supplement 1. Selected strong (top) and weak (bottom) relationships between explanatory variables and P. putida invader survival at 24 hr post-invasion.

Figure 3—figure supplement 1.

Colours represent the mean abundance of OTUs belong to Functional Group 18 in each community (blue low, red high).
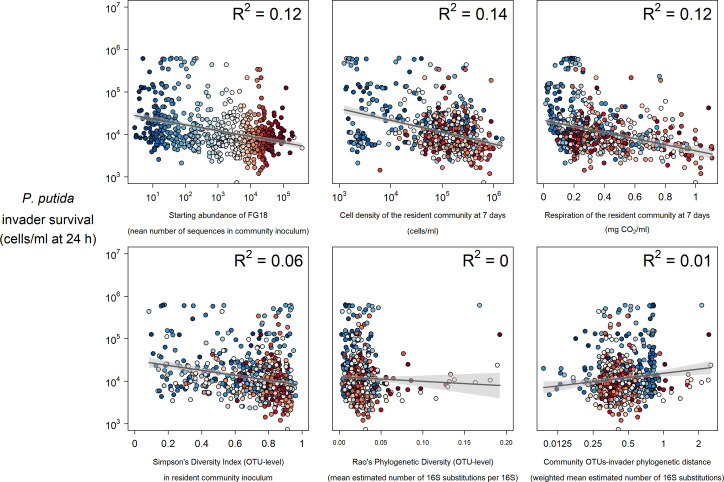
Figure 3—figure supplement 2. Relationships between enzyme activity and P. fluorescens invader survival at 24 hr post-invasion.

Figure 3—figure supplement 2.

Colours represent the mean abundance of OTUs belong to Functional Group 18 in each community (blue low, red high).
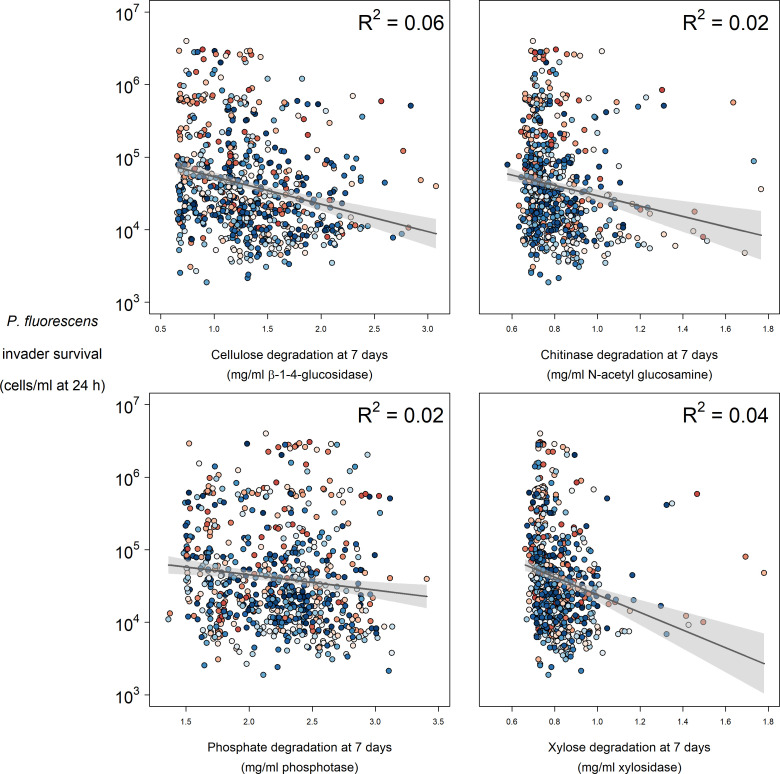
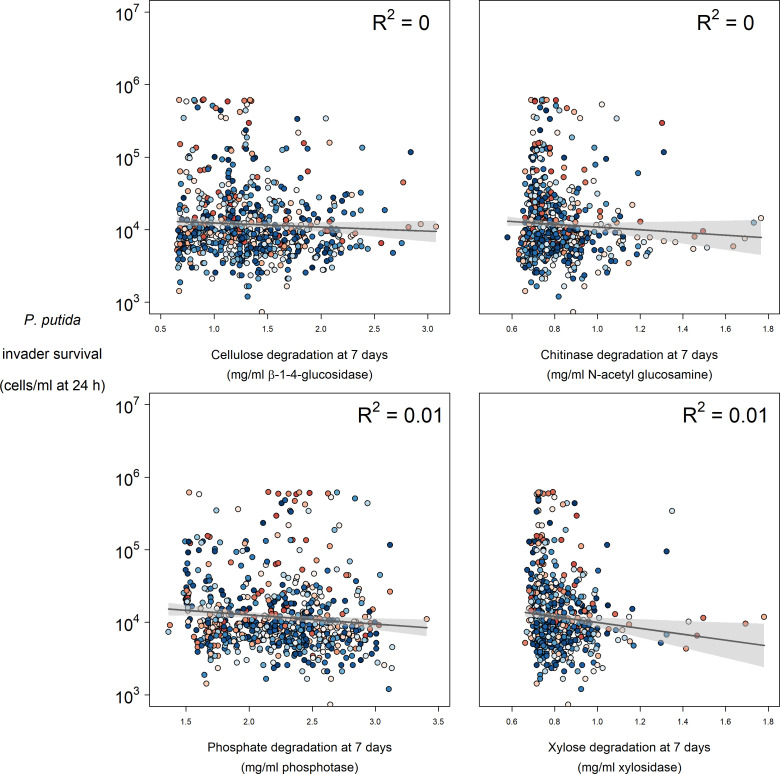
Figure 3—figure supplement 3. Relationships between enzyme activity and P. putida invader survival at 24 hr post-invasion.

Figure 3—figure supplement 3.

Colours represent the mean abundance of OTUs belong to Functional Group 18 in each community (blue low, red high).