. 2021 Sep 7;10:e67605. doi: 10.7554/eLife.67605

Figure 1. Biochemical characterization of TDP-43 fragments bound to oligonucleotide targets.

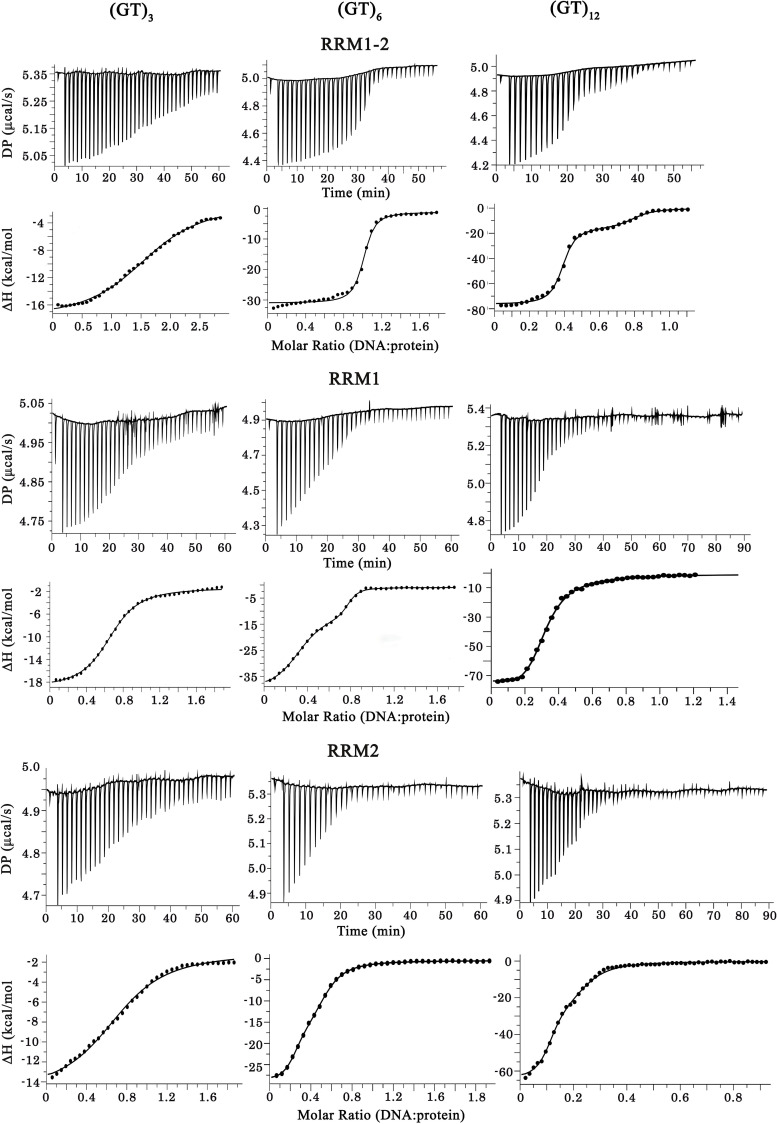
(a) Schematic representation of TDP-43 domains. Numbers indicate the boundaries according to the full-length protein sequence (NP_031401). The available 3D structure of N-terminal (PDB 2N4P), RRMs (PDB 4BS2), and C-terminal (PDB 2N3X) are also shown together with β-strands and α-helices. The boundaries of all three recombinant RRM fragments (RRM1–2, RRM1, and RRM2) used in this study are indicated. (b) Cross-linking experiments using increasing RRM1–2 protein concentrations, (GT)24-loop (10 pmol) and BS3 as cross-linking reagent. Cross-linked proteins are indicated with head-arrows. Last lane corresponds to the experiment in absence of BS3. (c) Electrophoretic Mobility-Shift Assay (EMSA) experiments were performed by using increasing protein concentrations and 10 pmol of a stem-loop DNA containing a (GT)24 repeats ((GT)24-loop). When indicated, the sample was treated with SDS in order to disassemble DNA-protein complexes. Free or protein-containing (GT)24-loop are indicated by head-arrows. (d) Binding of TDP-43 fragments to (GT)-rich oligonucleotides containing three (diamonds), six (squares) or twelve (circles) GT-repeats was monitored by ITC. At the bottom, plot of ITC titration curves for oligonucleotides that can bind two protein monomers (RRM1/(GT)6, RRM2/(GT)6 and RRM1–2/(GT)12). Plateaus corresponding to dimer and monomer states are indicated (red, green and blue curves correspond to RRM1–2, RRM1, and RRM2, respectively). Lower right panel: Kd1/Kd2 ratios obtained from (GT)12 or (GT)6 titration data. The binding of RRM1–2 to GT repeats is highly cooperative which is not observed for isolated RRM1 and RRM2. Thermodynamic parameters and ITC statistics are shown in Supplementary file 3. Raw thermograms are shown in Figure 1—figure supplement 2.

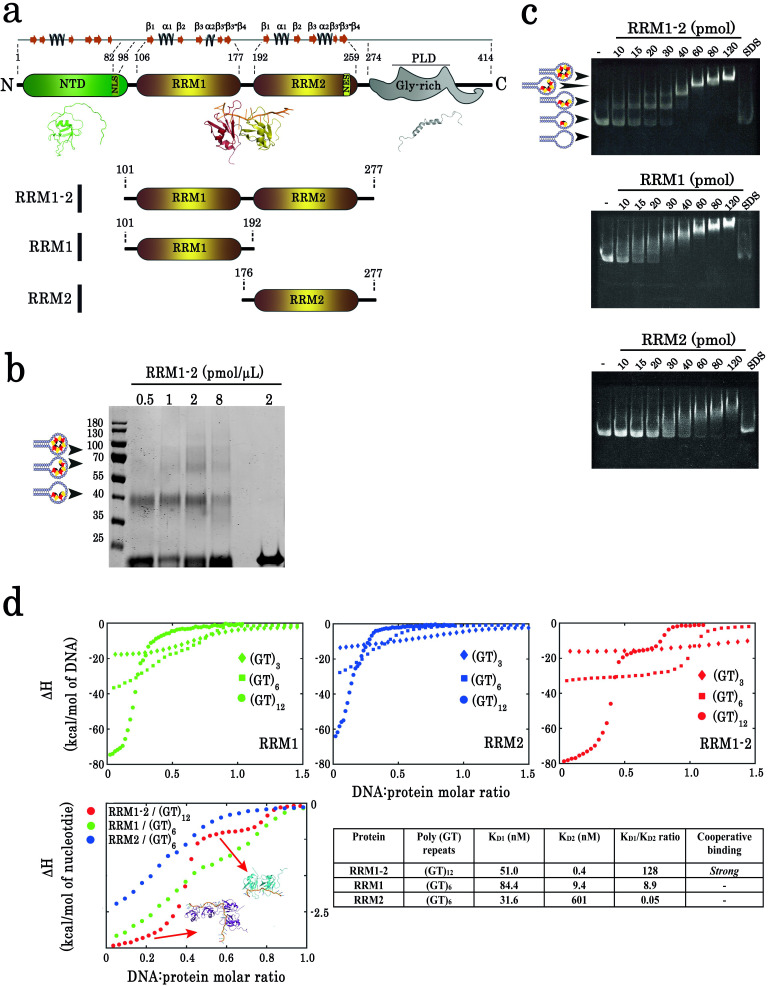
Figure 1—source data 1. SDS-polyacrylamide gel electrophoresis of samples from cross-linking experiments performed in absence of benzonase (see legend of Figure 1b).
Figure 1—source data 2. Electrophoretic Mobility-Shift Assay (EMSA) experiments on RRM1–2 (see legend of Figure 1c).
Figure 1—source data 3. EMSA experiments on RRM1 (see legend of Figure 1c).
Figure 1—source data 4. EMSA experiments on RRM2 (see legend of Figure 1c).
Figure 1—source data 5. ITC data obtained from the binding of TDP-43 fragments to (GT)-rich oligonucleotides (See legend Figure 1d).

Figure 1.

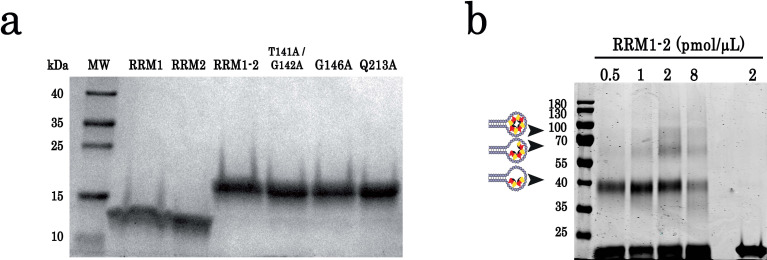
Figure 1—figure supplement 1. SDS-polyacrylamide gel electrophoresis of purified proteins and cross-linking experiments.

Figure 1—figure supplement 1.

(a) SDS-polyacrylamide gel electrophoresis of purified TDP-43 protein fragments (RRM1, RRM2, and RRM1–2) and RRM1–2 mutants (T141/G142, G146A, and Q213A). Molecular mass standards are indicated on the left. (b) Cross-linking experiments using increasing protein concentrations, (GT)24-loop (10 pmol) and BS3 as cross-linking reagent. All samples were treated with benzonase as global control of crosslinking experiments showed in Figure 1. DNase treatment was performed at room temperature during 30 min. Cross-linked proteins are indicated with head-arrows. Different controls were also performed.
Figure 1—figure supplement 1—source data 1. SDS-polyacrylamide gel electrophoresis of purified proteins (See legend of Figure 1—figure supplement 1a).
Figure 1—figure supplement 1—source data 2. SDS-polyacrylamide gel electrophoresis of samples from cross-linking experiments performed in presence of benzonase (see legend of Figure 1—figure supplement 1b).
Figure 1—figure supplement 2. Raw calorigrams corresponding to the ITC curves displayed in Figure 1d.

Figure 1—figure supplement 2.

Figure 1—figure supplement 2—source data 1. ITC data obtained from the binding of TDP-43 fragments to (GT)-rich oligonucleotides (See legend of Figure 1—figure supplement 2).