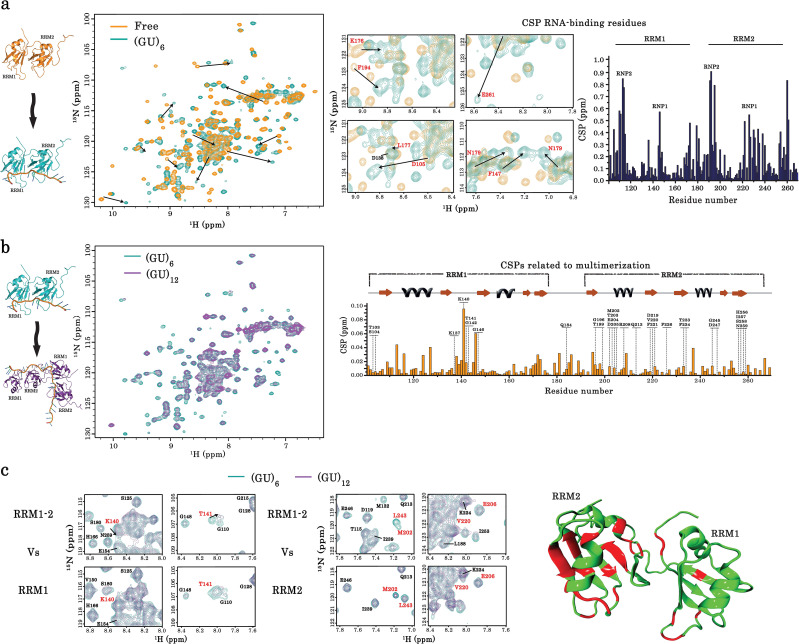
Figure 2. Identification of TDP-43 residues involved in its dimerization on GU-repeats.
(a) NMR spectra of free and bound RRM1–2. Left, superimposition of 1H-15N SOFAST-HMQC spectra of 15N-labeled RRM1–2 in the free (orange) and (GU)6 RNA-bound (turquoise) forms. Residues displaying the largest chemical shift perturbations (CSP) are indicated by arrows. Middle, zoom in on NMR spectra (left) showing the CSPs for some residues (highlighted in red) upon (GU)6 RNA binding. Right, plot of CSPs occurring in RRM1–2 upon (GU)6 RNA binding. The combined CSPs were calculated as reported (Williamson, 2013) and follow the same trajectories as previously published (Lukavsky et al., 2013) for RRM1–2 bound to AUG12 (PDB 4BS2). (b) NMR spectra of monomeric and dimeric forms of RRM1–2 bound to GU-repeats. Left, superimposition of 1H-15N SOFAST-HMQC spectra of 15N-labeled RRM1–2 bound to (GU)6 (turquoise) or (GU)12 (magenta). Right, combined CSPs, observed for monomeric and dimeric couples, plotted and linked to the secondary structures on top. (c) Left, zoom in on NMR spectra (b) showing RRM1–2 residues displaying particular CSPs, resonance disappearing, or peak broadening (in red) as compared to respective residues in RRM1 or RRM2 fragments. Right, all affected residues upon RRM1–2 dimerization are highlighted in red using molecular modelling approaches on RRM1–2 free fragment (see methods). Based on the above comparative NMR study, 28 residues were selected as candidates for mutagenesis approach combined to a detailed cellular and biochemical investigation.


