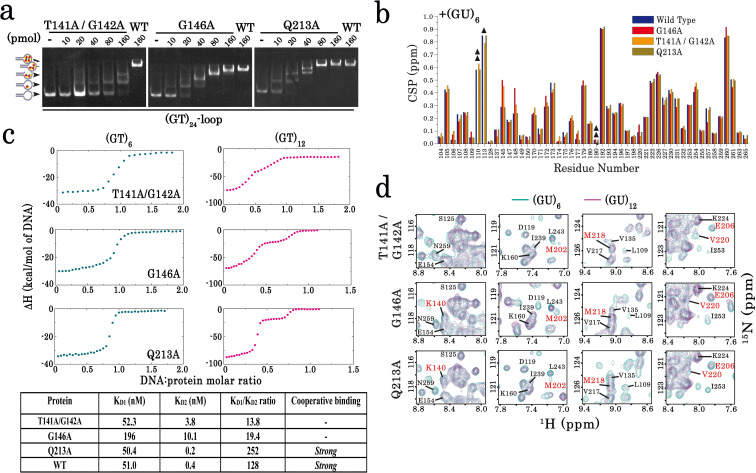
Figure 4. Characterization of TDP-43 mutants with an impaired cooperative binding to RNA.
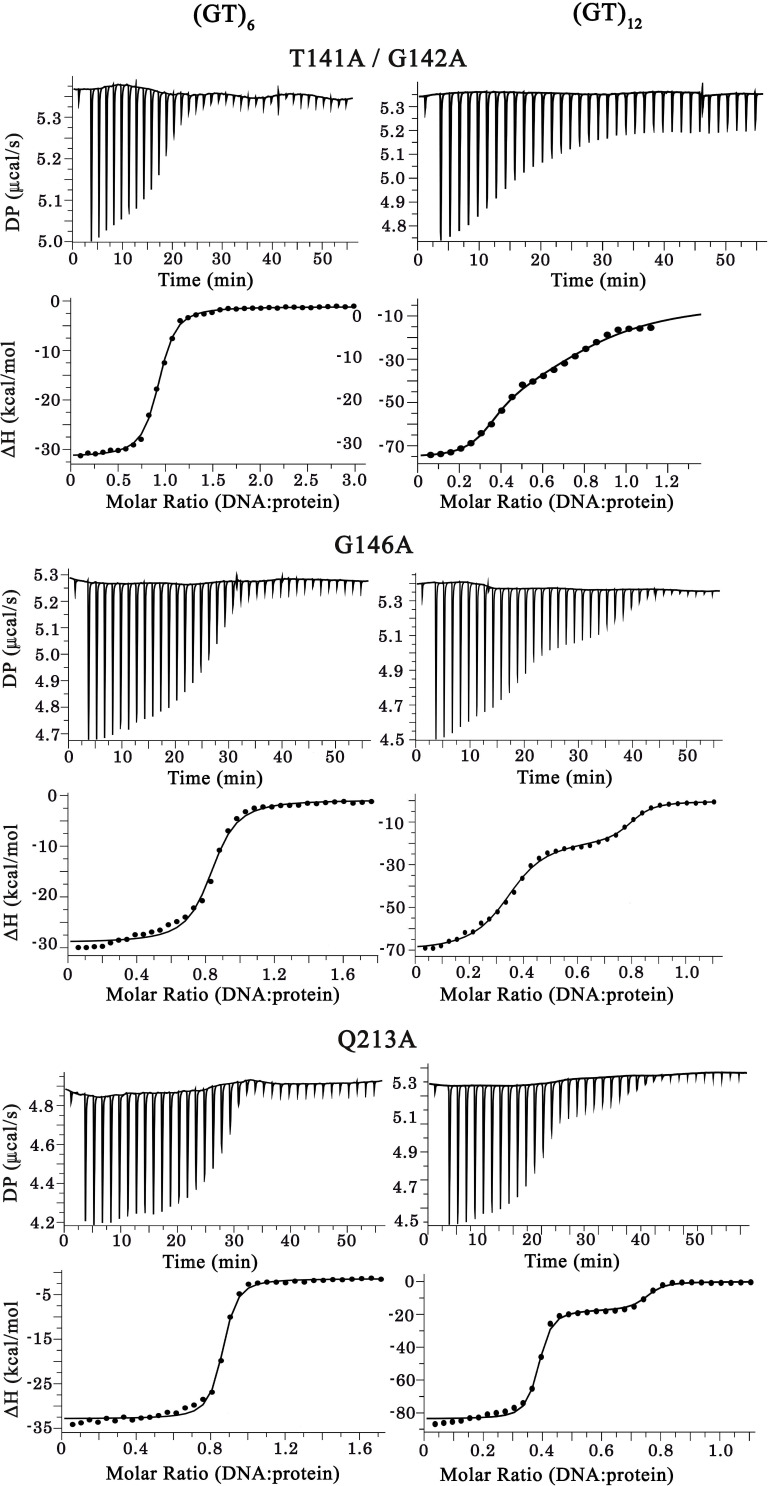
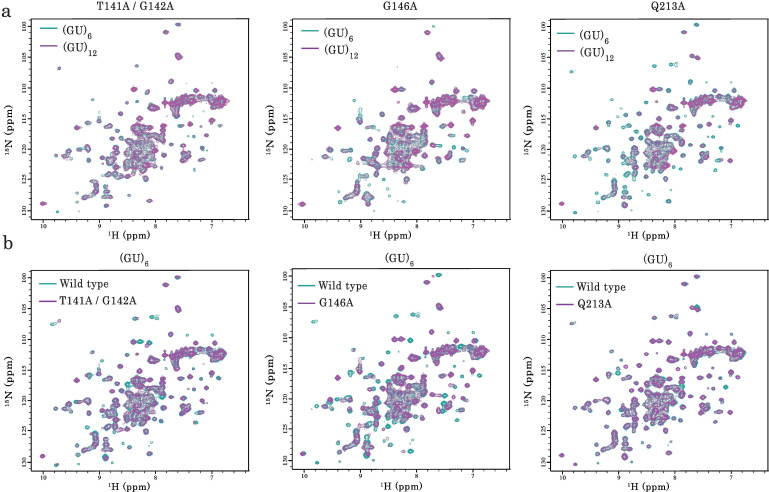
(a) EMSA experiments were performed by using increasing protein concentrations of T141A/G142A, G146A, and Q213A mutants and 10 pmol of a stem-loop DNA to assess multimerization changes on RRM1–2 (as in Figure 1c). Saturated amounts of wild-type RRM1–2 were used as a control (last lane). DNA-protein complexes are pointed out with head-arrows. (b) Plot showing CSPs for RNA-binding residues along RRM1–2 mutants bound to (GU)6 compared to their free forms. In most cases, the binding to (GU)6 RNA provokes CSPs comparable to the wild-type RRM1–2. ΔΔ, ambiguous assignment; Δ, signal vanishing. (c) The binding of RRM1–2 mutants to (GT)6 or (GT)12 oligonucleotides, was monitored by ITC. Whereas the ITC curves of wild type and Q213A are similar (see Figure 1d), the ITC curves related to T141A/G142A and G146A mutants decrease more continuously with less marked plateaus, reflecting an impaired cooperative binding to GT repeats. Lower panel: Kd1/Kd2 ratios obtained from ITC data. T141A/G142A and G146A have lower Kd1/Kd2 ratio values than wild type and Q213A, reflecting an impaired cooperativity. ITC statistics with thermodynamic parameters are indicated in Supplementary file 4. (d) Zoom in on the superimposed 1H-15N SOFAST-HMQC spectra (see full NMR spectra in Figure 4—figure supplement 2) of 15N-labeled RRM1–2 mutants bound to (GU)6 (turquoise) or to (GU)12 (magenta). The residues affected during wild-type RRM1–2 dimerization (see Figure 2b,c) are highlighted (red). Q213A mutant shows the same CSPs as the wild-type protein. However, in the case of T141A/G142A and G146A, we no longer detected the CSPs associated to dimerization.


