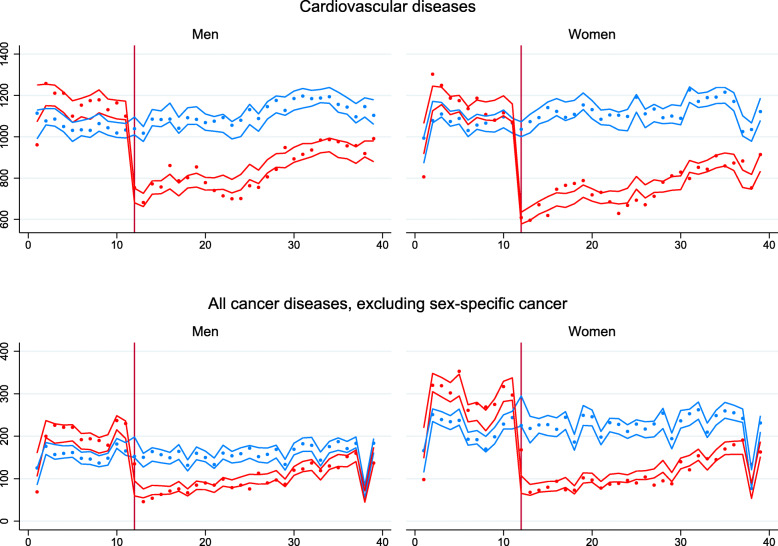
Fig. 2.
Number of new cases by sex of cardiovascular diseases and cancers, excluding sex-specific cancers, during the first 39 weeks of the year, 2017-2020. Points represent the average number of events (new cases diagnosed) per week for all cancers and cardiovascular events during the first 39 weeks of the year. Cancers exclude sex-specific conditions such as breast, cervical, or testicular cancer to facilitate comparisons between genders. Cardiovascular events include stroke and myocardial infarction. Solid lines are the point estimate for the fitted model. Colored areas around the lines are the 95% confidence intervals for the fitted model. In blue, the cases observed in the years 2017–2019 (used as a control group). In red, the number of patients diagnosed in 2020 (affected by the COVID-19 pandemic). The vertical line represents the starting week of the first population-level interventions for COVID-19 in Chile (week 12)

