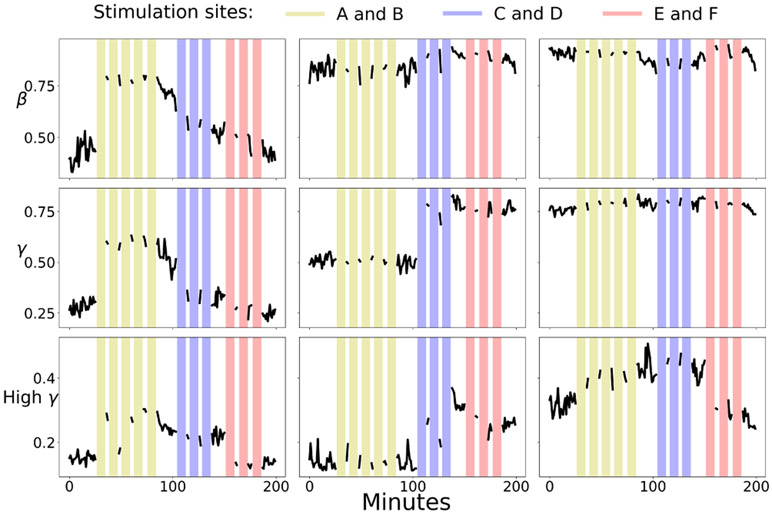
Fig. 4.
A time series of coherence values for three electrode channel pairs. Colored vertical bars indicate stimulation sessions. The left, center, and right plots indicate coherence between channels A and B, C and D, and E and F respectively. Yellow, light blue, and pink lines indicate 10 minute periods of paired stimulation between channels A and B, C and D, and E and F respectively.

