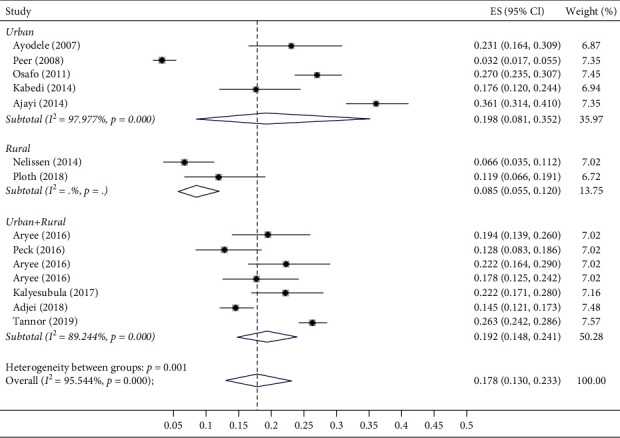
Figure 3.

Forest plot showing the prevalence of CKD in urban, rural, and mixed populations. ES, effect size; CI, confidence interval.

Forest plot showing the prevalence of CKD in urban, rural, and mixed populations. ES, effect size; CI, confidence interval.