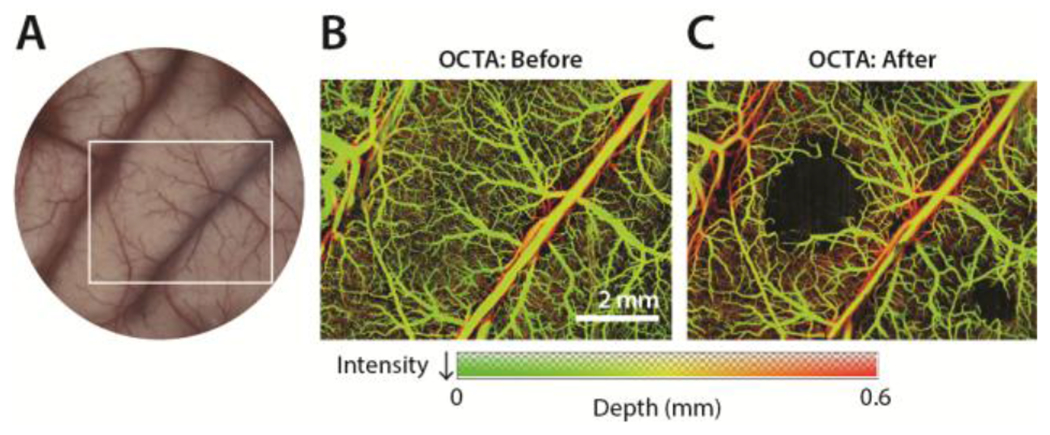
Figure 4. In vivo optical coherence tomography.

A) Cranial window. White box indicates sample region imaged by OCTA. B) Maximum intensity projection OCTA image prior to stroke. C) 3 hours post-stroke OCTA image acquisition reveals the presence of lesions.
