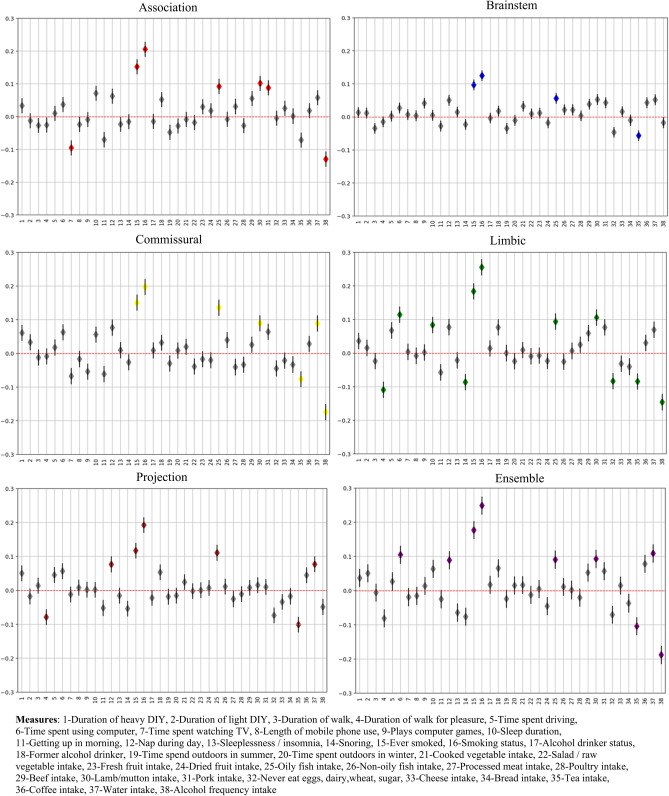
Figure 4.
Association of daily lifestyle measures and brain-PAD. For each model, the numbers on the x-axis represents the order of the daily lifestyle measures summarised in the legend, while the regression coefficient (the diamond shape represents the beta coefficient) values are reported in the y-axis along with their standard error. Grey color indicates non-significant association. A unique color was assigned to each group measures(e.g physical activity).

