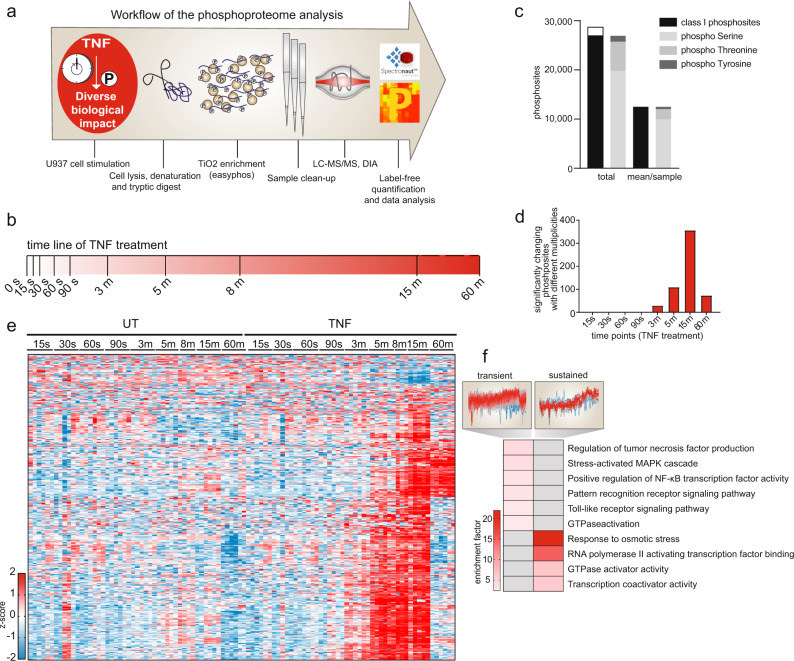
Fig. 1. Temporal dissection of TNF-regulated phosphorylation events.
a Workflow of the phosphoproteome analysis. b Schematic overview of the time points used for TNF treatment (100 ng/ml). c Bar graph demonstrating the number of detected phosphosites in U937 cells. Class I sites (in black) are phosphosites with a localization probability of > 75%. d Histogram depicting the numbers of significantly changing phosphosites along eight different time points compared with the respective untreated control (FDR < 0.05; see Methods for an 8-min time point). e Heatmap of significantly changing phosphosites along the time course compared with their respective untreated controls (Student’s t-test; FDR < 0.05). Z-scores of various time points and the replicates (n = 4 biologically independent experiments) in red for intensities higher than the mean and in blue for intensities lower than the mean of the respective phosphosites across all samples. f Fisher’s exact test of transient phosphosites induced upon TNF, which are downregulated after 15 min and sustained phosphosites, which are still upregulated at 60 min of treatment (two-sided, p < 0.002). The red scale resembles enrichment, while gray represents missing values/no enrichment. The profiles are color-coded according to their distance from the respective cluster center (red is close to the center, blue is further away from the center). Source data are provided as source file.

