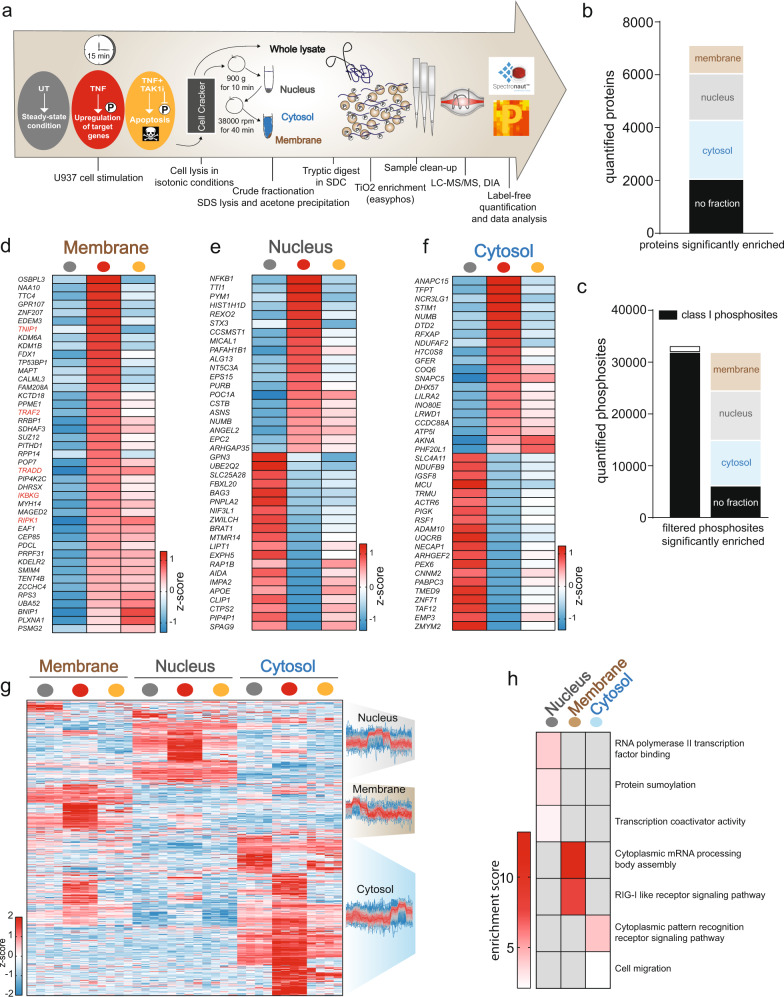
Fig. 3. TNF-induced phosphorylation strongly affects translocation of signaling members downstream of TAK1.
a Workflow of crude fractionation with subsequent proteome and phosphoproteome analysis of U937 cells. Gray = untreated, red = TNF, orange = TNF + TAK1 inhibitor. b Most quantified proteins are significantly enriched in one of membrane, nucleus, and cytosol fractions (two-sided Student’s t-test FDR < 0.05). c Total number of quantified phosphosites and the numbers of phosphosites significantly enriched in the three fractions (two-sided Student’s t-test FDR < 0.05). Class-I sites (in black) are phosphosites with a localization probability of > 75%. d Heatmap of means of z-scored protein intensities enriched in the membrane upon TNF treatment (two-sided Student’s t-test, -Log10 p > 1.29, Log2 fold change > 0.5). e Heatmap of means of the 20 most strongly up- and downregulated z-scored protein intensities in the nucleus upon TNF treatment (two-sided Student’s t-test -Log10 p > 1.5, Log2 fold change > 0.5 or < −0.5). f Heatmap of means of the 20 most strongly up- and downregulated z-scored protein intensities in the cytosol upon TNF treatment (two-sided Student’s t-test -Log10 p > 1.5, Log2 fold change > 3 or < −3). g Heatmap of z-scored phosphosite intensities that are significantly regulated upon TNF treatment in the membrane, nucleus, and cytosol (two-sided Student’s t-test FDR < 0.05). The profiles are color-coded according to their distance from the respective cluster center (red is close to the center, blue is further away from the center). h Fisher’s exact test of phosphosites significantly enriched in the nucleus, membrane (p < 0.001), and cytosol (p < 0.01). The red scale represents enrichment, while gray represents no enrichment. Source data are provided as source file.

