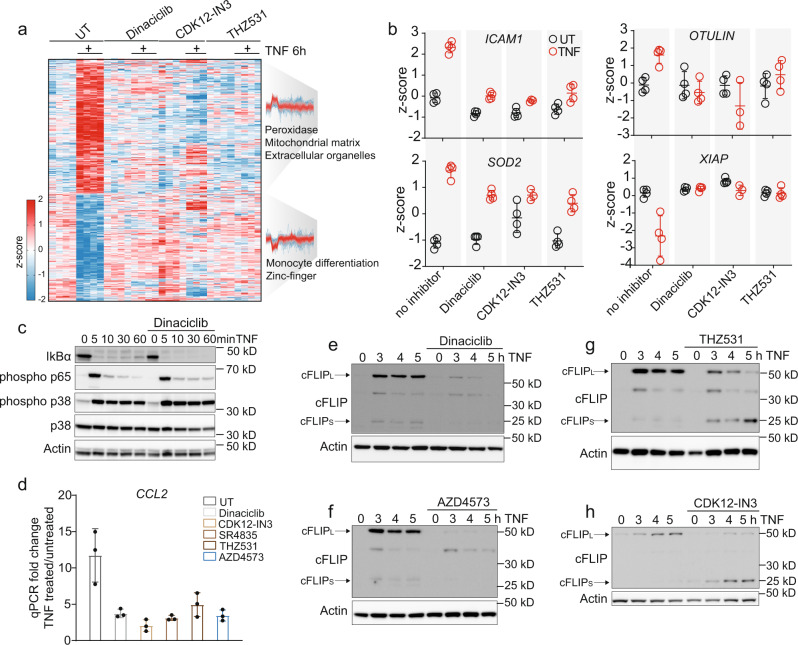
Fig. 5. CDK9 and CDK12/13 inhibitors potently reduce transcription of TNF-target genes.
a Heatmap of z-scored protein intensities significantly changed upon TNF treatment for 6 h in U937 cells (FDR < 0.05). Cells were additionally treated with Dinaciclib (6 nM), CDK12-IN3 (60 nM), and THZ531 (400 nM). Fisher’s exact test on up- and downregulated protein clusters (two-sided Student’s t-test, FDR < 0.001). The profiles are color-coded according to their distance from the respective cluster center (red is close to the center, blue is further away from the center). b Z-scored protein levels of selected TNF-target genes and members of the TNF-signaling pathway (±SD, n = 4 biologically independent experiments). c Immunoblot of U937 cells treated with TNF alone and in combination with the pan-CDK inhibitor Dinaciclib. Proteins were blotted for IκBα, phosphorylated p65, phosphorylated, and total p38 and β-actin (loading control) (n = 2 biologically independent experiments). d qPCR of CCL2 of U937 cells treated for 4 h with TNF alone or in combination with CDK inhibitors Dinaciclib (6 nM), CDK12-IN3 (60 nM), SR4835 (160 nM), THZ531 (200 nM) and AZD4573 (6 nM) (±SD, n = 3 biologically independent experiments). e–h U937 cells treated with TNF alone and in combination with CDK inhibitors (concentrations as in d) were blotted for cFLIP and β-actin (n = 2 biologically independent experiments). Source data are provided as source file.

