Figure 1.

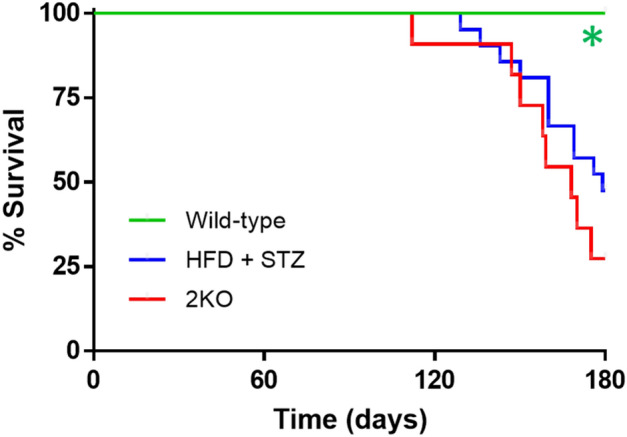
Kaplan–Meier survival curves for in wild-type (N = 8), Leprdb/db eNOS−/− (2KO, N = 11), and high fat diet plus low dose STZ-treated (HFD + STZ, N = 20) mice. *P < 0.05 by χ2 and Mantel-Cox log-rank test compared to other groups.

Kaplan–Meier survival curves for in wild-type (N = 8), Leprdb/db eNOS−/− (2KO, N = 11), and high fat diet plus low dose STZ-treated (HFD + STZ, N = 20) mice. *P < 0.05 by χ2 and Mantel-Cox log-rank test compared to other groups.