Figure 3.
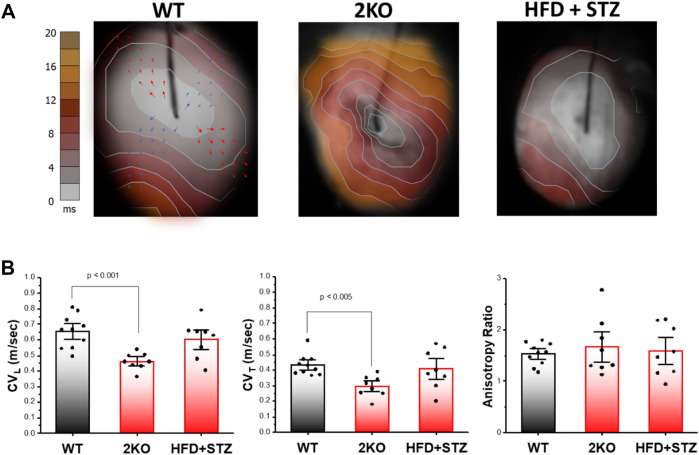
Optical mapping of action potentials from the anterior epicardial surface of Langendorff perfused hearts. (A) Activation maps showing impulse propagation in wild type (WT), Leprdb/db eNOS−/− (2KO) and high fat diet plus low dose STZ-treated (HFD + STZ) mice. Stimulation was performed from the center of the mapping field of view at a cycle length of 110 ms. Arrows shown in WT example depict local conduction velocity vectors that were measured in the fast (longitudinal) and slow (transverse) direction of propagation. (B) Summary data for conduction velocity in the longitudinal (CVL) and transverse (CVT) directions, as well as CVL/CVT (anisotropy ratio) in WT (n = 10), 2KO (n = 8) and HFD + STZ treated mice (n = 8). Data are mean ± SEM. P values were generated by Fisher’s least significant difference test for multiple comparisons.

