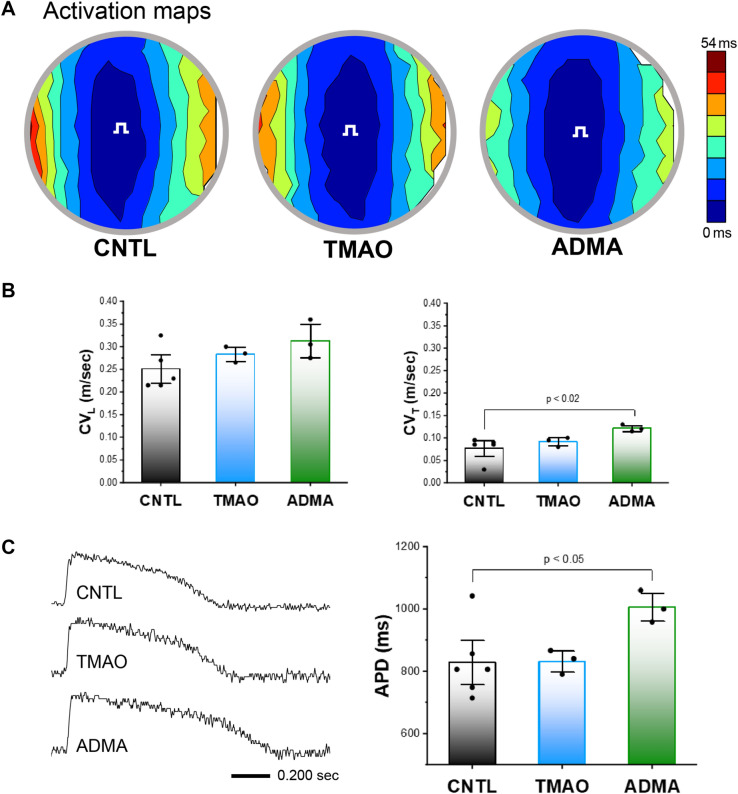
Figure 7.
Effects of TMAO and ADMA on impulse conduction in human cardiac myocyte monolayers. (A) Activation maps showing impulse propagation in response to TMAO (100 µM), ADMA (10 µM) or DMSO vehicle only (control, CNTL). Stimulus symbol (square wave) is the site of point infrared stimulation. (B) Summary data for conduction velocity in the longitudinal (CVL) and transverse (CVT) directions. Effects of TMAO and ADMA on action potential duration (APD) in human cardiac myocyte monolayers (C). Single site action potentials (left) in the presence of TMAO (100 µM), ADMA (10 µM) or DMSO vehicle only (control). Summary data (right) for APD. Data are mean ± SEM. P values were generated by Fisher’s least significant difference test for multiple comparisons.

