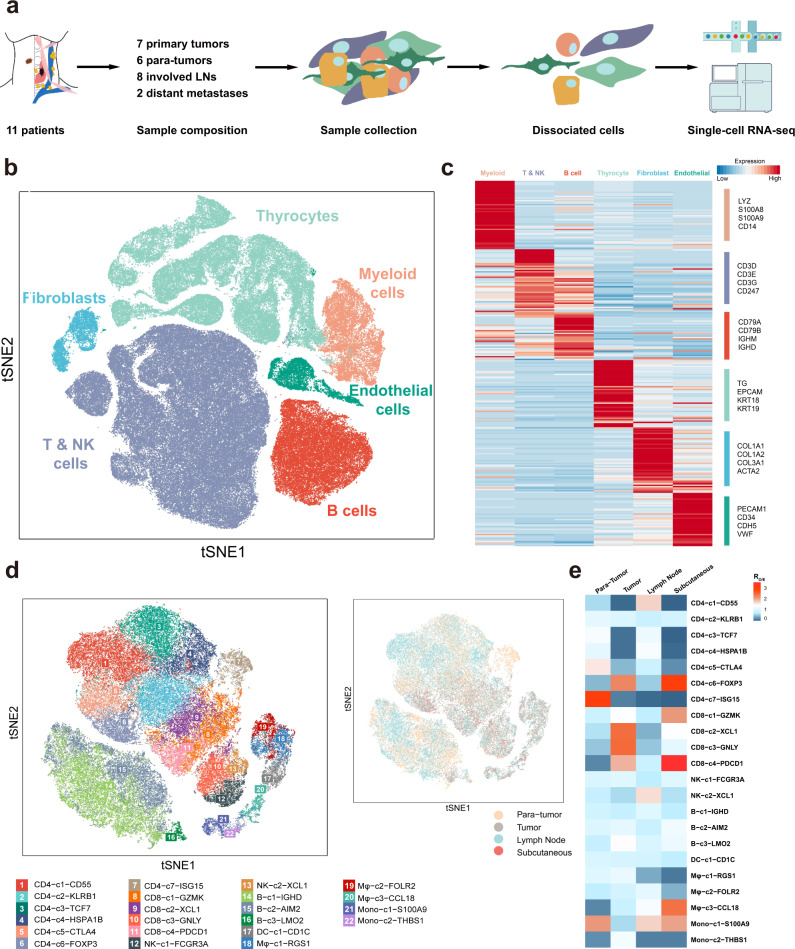
Fig. 1. Expression profiling of 158,577 single cells in PTCs.
a Workflow of sample composition, processing and bioinformatic analyses for 23 samples in the present study. b t-SNE plot of all high-quality cells profiled in the present study colored by major cell lineage. c, Heatmap of the canonical and curated marker genes for major cell lineages. d t-SNE projection showing the landscape of immune cells, colored by cluster (left) and tissue (right). e Tissue preference for each immune cell subcluster estimated by Ro/e. Source data are provided in the Source Data file.

