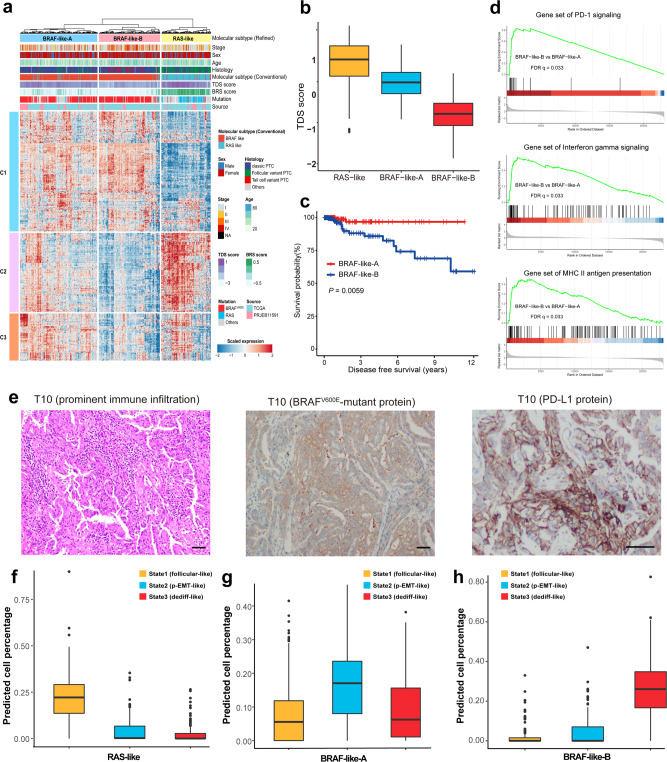
Fig. 5. Modified molecular subtypes and deconvolution of bulk RNA-seq profiles.
a Heatmap of the top pseudotime-associated genes (n = 480) in 613 PTCs from the integrated bulk cohort (TCGA and PRJEB11591). Hierarchical clustering identifies three molecular subtypes of PTCs. b Differences in TDS scores of the three PTC molecular subtypes, RAS-like (n = 161), BRAF-like-A (n = 253) and BRAF-like-B (n = 199) defined in our study. c Kaplan–Meier plot for disease-free survival of patients with BRAF-like-A (n = 191) and BRAF-like-B (n = 171) PTCs in the TCGA cohort. Log-rank test (two-sided). d GSEA plots showing significantly enriched pathways in the BRAF-like-B subtype compared with the BRAF-like-A subtype. e H&E-stained or IHC images showing prominent immune infiltration, positive BRAF V600E-mutant protein and PD-L1 protein expressions in the primary tumor (T10) of Case 10. Three independent experiments were performed and generated similar results. Scale bar = 50 µm. Deconvolution analysis showing thyrocyte phenotype composition in the (f) RAS-like subtype (n = 161), (g) BRAF-like-A subtype (n = 253) and (h) BRAF-like-B subtype (n = 199). In (b), (f), (g) and (h), the middle lines of the boxplots show the median (central line), the lower and upper hinges show the 25–75% interquartile range (IQR), and the whiskers extend from the hinge to the farthest data point within a maximum of 1.5 x IQR. Source data are provided in the Source data file.

