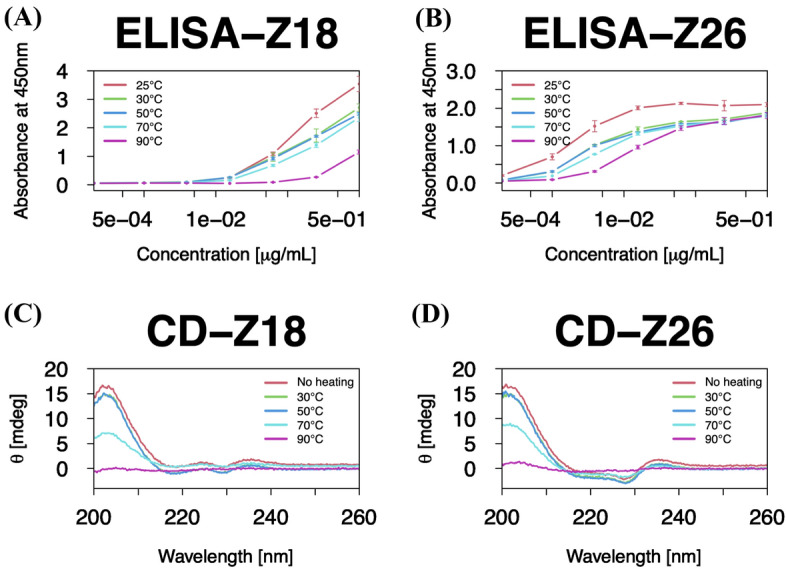
Figure 2.

Binding capabilities and secondary structures of the single-domain VHH antibodies show similar trends between Z18 and Z26. (A,B) ELISA to quantify binding of (A) Z18 and (B) Z26 to HSA. ELISA was independently repeated three times, and the average values were plotted with the standard deviations. (C,D) CD spectra of (C) Z18 and (D) Z26. CD measurements were performed with 0.15 mg/mL of a sample in PBS. All graphs in this article were made by R packages41.
