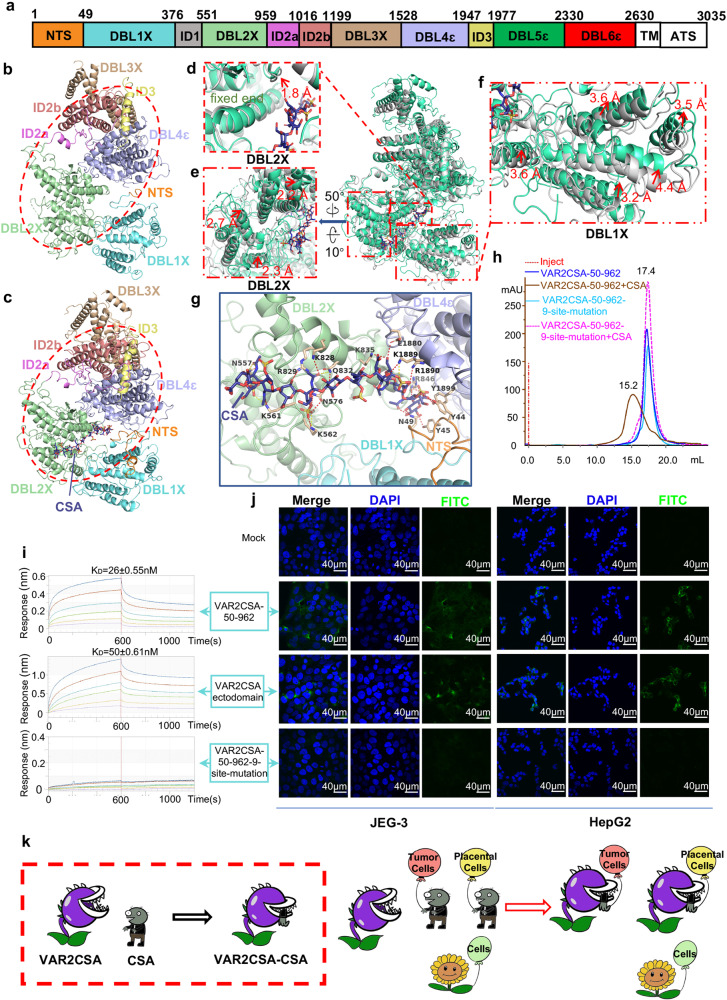
Fig. 1. Overall structures of VAR2CSA ectodomain.
a Schematic sequence architecture of VAR2CSA of P. falciparum 3D7 strain. Domains reconstructed according to the cryo-EM density map were colored respectively. NTS, orange; DBL1X, aquamarine; DBL2X, pale green; ID2a, violet; ID2b, salmon; DBL3X, wheat; DBL4ɛ, light blue; ID3, pale yellow; DBL5ɛ, green; DBL6ɛ, red; ID1, gray. Color codes were used throughout this study unless otherwise noted. b The ribbon diagram of apo VAR2CSA ectodomain core region. c The ribbon diagram of VAR2CSA-CSA core region. The core center was highlighted using red ovals in b and c. d–f Structural comparison between VAR2CSA-CSA with apo VAR2CSA ectodomain by aligning DBL4ɛ domains. The helix associated with CSA in DBL2X domain exhibited a 1.8 Å bend outward at the binding site while the distal end remained fixed (d). The surficial helixes in DBL2X moved about 2 Å toward the CSA binding pocket (e). The DBL1X domain went through a significant conformational change at a distance of more than 3.2 Å to close the CSA binding pocket (f). g Interactions between CSA and VAR2CSA were shown in the binding pocket. Interacting residues from NTS, DBL2X, and DBL4ɛ were highlighted individually. h Gel filtration chromatography of VAR2CSA-50-962 and VAR2CSA-50-962-9-site-mutation (N557D, K561E, K562E, N576D, K828E, R829E, Q832E, K835E, R846E) in the presence or absence of CSA on a Superose 6 increase 10/300 GL column. i The binding kinetics of VAR2CSA ectodomain, VAR2CSA-50-962, and VAR2CSA-50-962-9-site-mutation were further assessed using Octet RED 96, and equilibrium constant (KD) values were calculated accordingly. j The binding activities of VAR2CSA-50-962, VAR2CSA ectodomain, and VAR2CSA-50-962-9-site-mutation to JEG-3 cells or HepG2 cells were tested by immunofluorescence assay using confocal fluorescence microscopy, respectively. Green (stained with anti-His-FITC antibody) indicated VAR2CSA proteins; blue (DAPI) represented cell nuclei. k Model of VAR2CSA recognizing both placental cells and tumor cells. The cartoon exhibited the mechanism of VAR2CSA capturing the CSA ligand and showed the conformational change upon CSA binding in a red frame. The cartoon also illustrated the mechanism of VAR2CSA characteristically recognizing either placental cells or tumor cells by identifying the specific CSA displayed on the cell surface. VAR2CSA was drawn as cannibal plants in two states corresponding to CSA binding or not, respectively. CSA modifications were drawn as zombies and other glycol-modifications as sunflowers. Cells were depicted as balloons in different colors. Tumor cells, salmon; Placental cells, yellow; Normal cells, light green.

