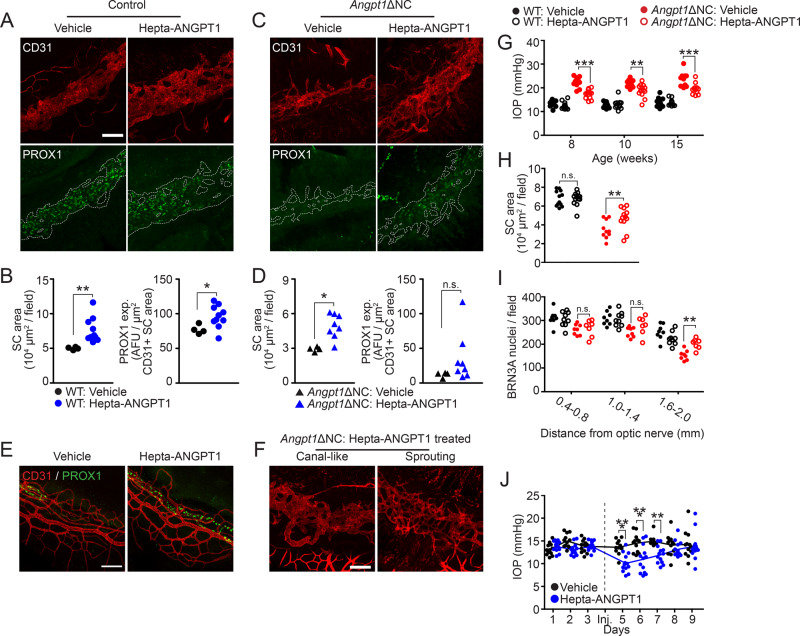
Fig. 8. ANGPT1 mimetic treatment increased SC area and lowered IOP in mice.
(A, quantified in B) Intra-peritoneal (IP) treatment with Hepta-ANGPT1 from birth to P14 led to increased SC area in WT (p = 0.0014) and (C, quantified in D) Angpt1ΔNC eyes (p = 0.0008). Wildtype, n = 4 (vehicle) and 10 (Hepta-ANGPT1), Angpt1ΔNC, n = 4 (vehicle) and 8 (Hepta-ANGPT1) animals from four independent litters. PROX1 expression in WT eyes was also increased, suggesting that this larger SC retained its fully differentiated phenotype (p = 0.0109). E Hepta-ANGPT1 treatment had no effect on the morphology of the limbal superficial capillary plexus suggesting the effect was specific to Schlemm’s canal. F Some Angpt1ΔNC eyes treated with Hepta-ANGPT1 exhibited a sprouting endothelial plexus in place of an organized, canal-like structure. G Intraocular pressure was measured at 8, 10, and 15 weeks in mice that received Hepta-ANGPT1 from birth to P14. Wildtype n = 12 (vehicle) and 13 (Hepta-ANGPT1), Angpt1ΔNC n = 10 (vehicle) and 14 (Hepta-ANGPT1) from four independent litters. H Following IOP measurement, average Schlemm’s canal area was measured in whole mount eyes by confocal microscopy and I BRN3A-positive retinal ganglion cells were quantified in retina flat mounts of the same animals. J To examine the acute effect of Hepta-ANGPT1 on IOP in adult WT eyes, 8-week-old C57Bl/6J mice received bilateral intravitreal injections of either 1 μg Hepta-ANGPT1 or PBS vehicle after 3 days of baseline IOP measurement. IOP was then measured daily for 5 days following injection. n = 12 (vehicle) and 13 (Hepta-ANGPT1). Scale bars represent 100 μm, quantified fields represent a total area of 262,277 μm2 (B, D, H) and 65,413 μm2 (I). AFU, background-subtracted arbitrary fluorescence units. Dashed lines in PROX1 panels indicate CD31 + SC area. *p < 0.05, **p < 0.01, ***p < 0.001 as determined by two-tailed Welch’s t-test (B, D) Df = 9 (WT, B) and 8 (Angpt1ΔNC, D) or two-way ANOVA followed by Bonferroni’s correction (G–J). Dfgroup = 3, Fgroup = 172.2 (G), Dftreatment = 1, Ftreatment = 4.6 (H), Dfgroup = 3, Fgroup = 11.92 (H), Dftreatment = 1, Ftreatment = 24.03 (J).

