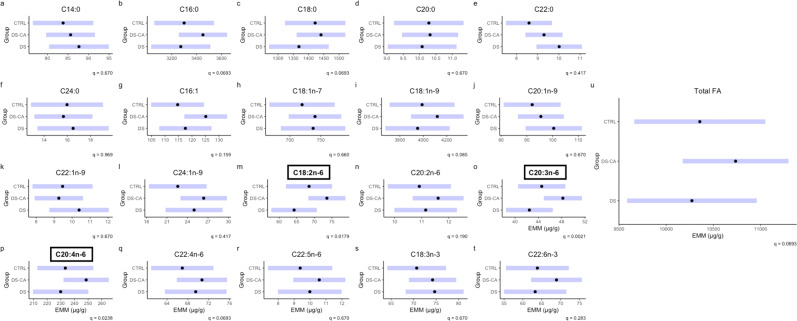
Fig. 2. Concentration of fatty acids in choline glycerophospholipids between groups.
Black dots represent the estimated marginal means for the group and purple bars represent the 95% confidence intervals based on linear models for the concentration of FA as a function of the group with age, PMI, pH, and sex as covariates. Subplots with boxed titles in bold font indicate significance between groups with q < 0.05. Concentrations are represented in µg/g.

