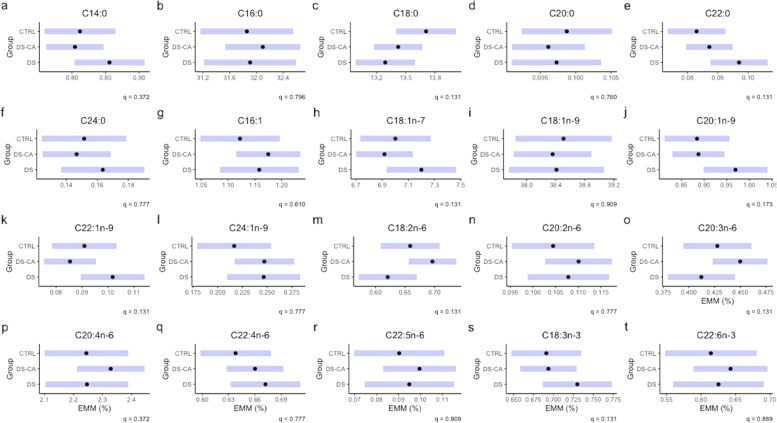
Fig. 3. Relative percentage of fatty acids in choline glycerophospholipids between groups.
Black dots represent the estimated marginal means for group and the purple bars represent the 95% confidence intervals based on linear models for the relative percentage of FA as a function of the group with Age, PMI, pH, and sex as covariates. The group term did not reach significance in any relative percentage model after correction for multiple comparisons.

