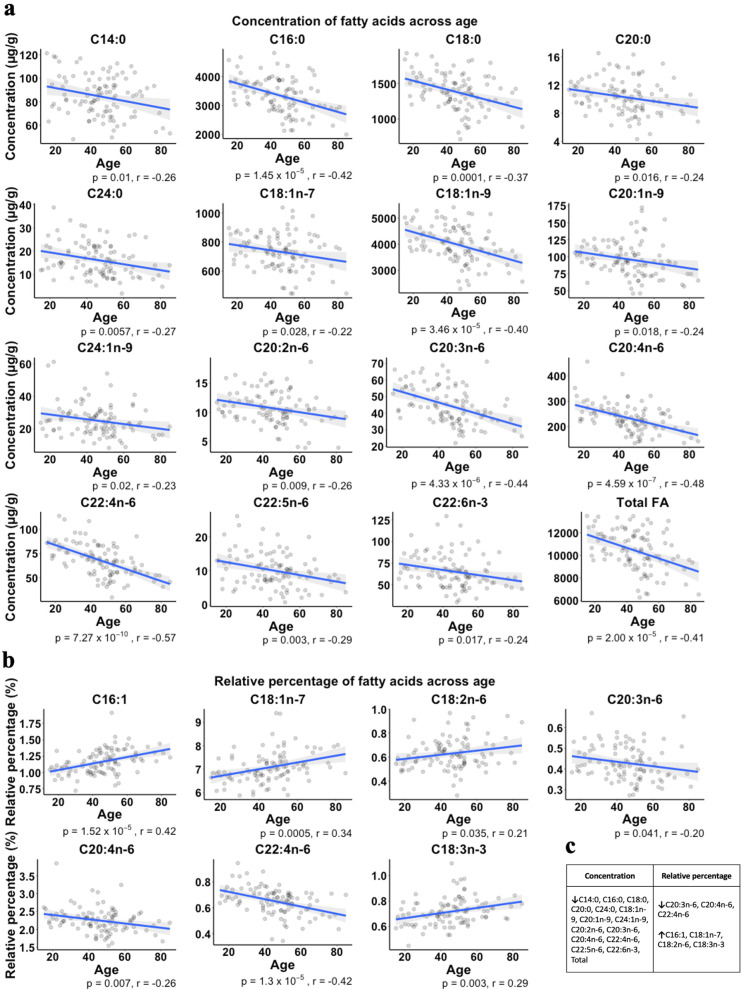
Fig. 4. Significant correlations between age and fatty acid quantitative metrics.
Significant Pearson correlations between (a) age (years) and concentrations (µg/g) of FAs and (b) age (yrs) and relative percentage. P-values and r-values are listed under each subplot. A summary table of these significant correlations is presented in (c) in which a negative correlation is represented by a downward arrow and a positive correlation is represented by an upward arrow.

