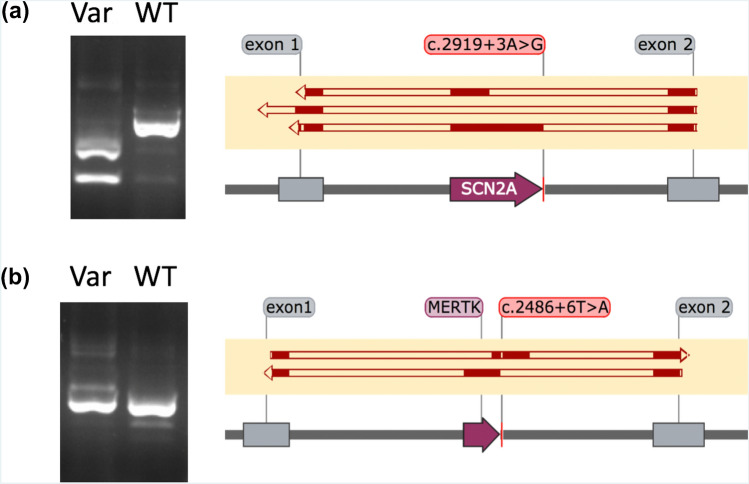
Figure 1.
Results from in vitro minigene assays demonstrating multiple consequences as a result of variants proximal to the canonical splice site. Left, gel electrophoresis snapshots of cDNA products amplified from primers designed for control exons within the minigene (exon 1 & exon 2). All prominent bands were cut out and Sanger sequenced. Right, solid red blocks illustrate alignment of sequenced cDNA transcripts to features within the minigene vector: control exons (grey boxes) and inserted exons (purple boxes); (a) SCN2A c.2919 + 3A>G, showing complete exon exclusion and exon truncation in minigene vectors containing the c.2919 + 3A>G variant (top two alignments) and normal splicing in minigene vectors containing the WT sequence (bottom alignment). The first resulted in a transcript with a truncated exon, NM_001040142.1:r.2563_2710del, and the second resulted in a complete exon skip, NM_001040142.1:r.2563_2919del. It is noteworthy that if these events were also observed in vivo then they may be considered differently using ACMG criteria; the exon truncation event resulted in a frameshift and introduction of a premature stop codon (PVS1), whereas the complete exon skipping event resulted in the inframe removal of 119 amino acids from the transcript (PM4); (b) MERTK c.2486 + 6T>A, showing a shifting of the exon included in the reading frame in minigene vectors containing the c.2486 + 6T>A variant (top alignment) and normal splicing in minigene vectors containing the WT sequence (bottom alignment). This novel variant is present in two individuals with severe rod-cone dystrophy, and resulted in the simultaneous usage of a cryptic exonic splice acceptor site and a cryptic intronic splice donor site creating a novel exon (chr2:112,779,939–112,780,082, GRCh37), and a premature stop codon in the penultimate exon, p.(Trp784Valfs*10). Original images for both SCN2A c.2919 + 3A>G and MERTK c.2486 + 6T>A are presented in Supplementary Figure S2.

