Figure 3.
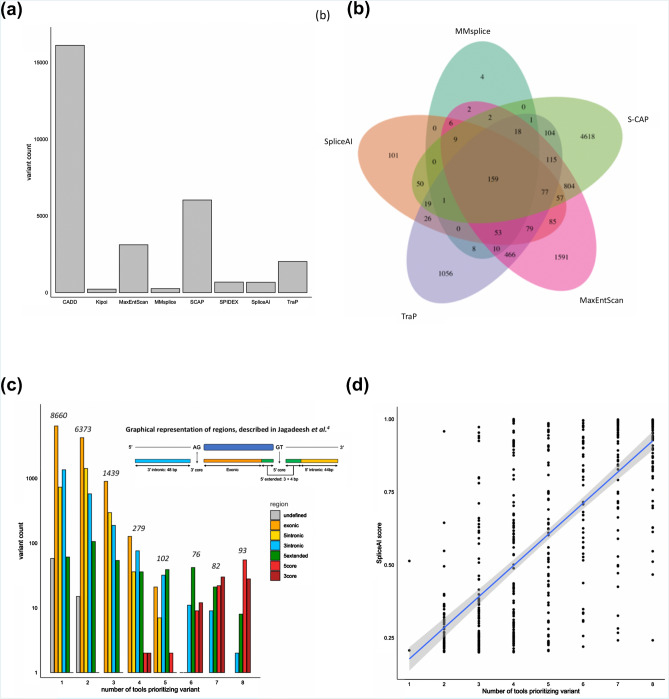
Summary of the overlap and correlations observed between the scores from in silico splicing prediction algorithms for 18,013 unique rare variants identified in a large cohort of 2783 individuals with rare disease undergoing genetic testing, specifically for syndromic and non-syndromic inherited retinal disorders. (a) Bar chart showing overall count of unique variants prioritized using pre-defined thresholds for each in silico prediction algorithm; (b) Overlap between the unique variants prioritized by the five most correlated in silico prediction tools; (c) Grouped bar chart demonstrating the overlap of variants prioritized by each tool segregated by the region of the genome that the variant impacts, as defined by Jagadeesh et al.16, demonstrating that variants prioritized by many tools are highly likely to be close the canonical splice sites (5′core, 3′core and 5′extended); (d) Correlation between SpliceAI score and the number of additional tools also prioritizing the variant for the 528 unique rare variants prioritized by SpliceAI.

