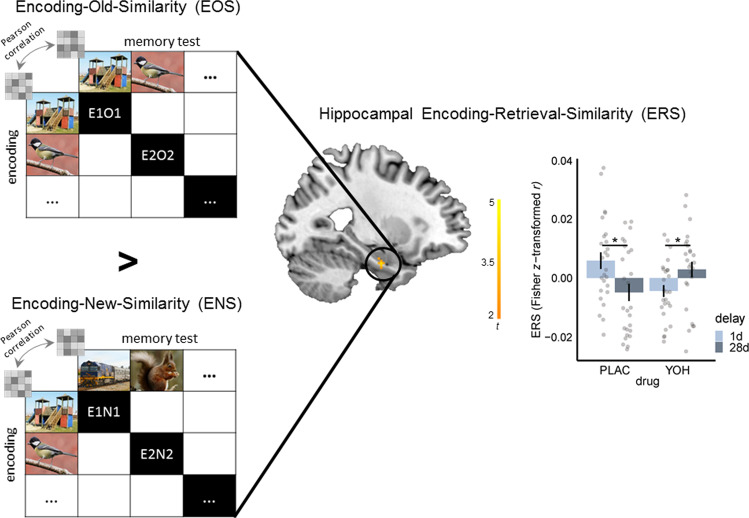
Fig. 4. Multivariate encoding-retrieval-similarity (ERS) analysis.
Participants of the placebo (PLAC) group showed a significant decrease in hippocampal pattern reinstatement, as reflected in ERS, from 28d relative to 1d (p = 0.010, two-tailed Welch’s t-test), while there was even a significant increase in hippocampal ERS from the 1d to the 28d test in the yohimbine (YOH) group (p = 0.031, two-tailed Welch’s t-test; drug × delay: SVC peak-level: x = −26, y = −10, z = −26, mixed ANOVA; n = 104 participants). Bonferroni correction was applied for the number of regions of interest in each analysis. All images are licensed under Creative Commons License; image of the playground courtesy of Tomasz Sienicki (https://commons.wikimedia.org/wiki/File:Playground_29_ubt.JPG; image unchanged); image of the bird courtesy of Francis C. Franklin (https://commons.wikimedia.org/wiki/File:Great_tit_side-on.jpg; image unchanged); image of the train courtesy of DBZ2313 (https://commons.wikimedia.org/wiki/File:Locomotive_NR27_hauling_Indian_Pacific_train_(cropped).jpg; image unchanged); and image of the squirrel courtesy of Peter Timing (https://commons.wikimedia.org/wiki/File:Squirrel_posing.jpg; image unchanged). Visualizations of the ERS results include the t-map for drug × delay superimposed on a sagittal section of a T1-weighted template image and the Fisher z-transformed r-values for the significant cluster in the contrast EOS > ENS. Bars represent mean ± SEM. Source data are provided as Source data file. *p < 0.050.

