Figure 3.
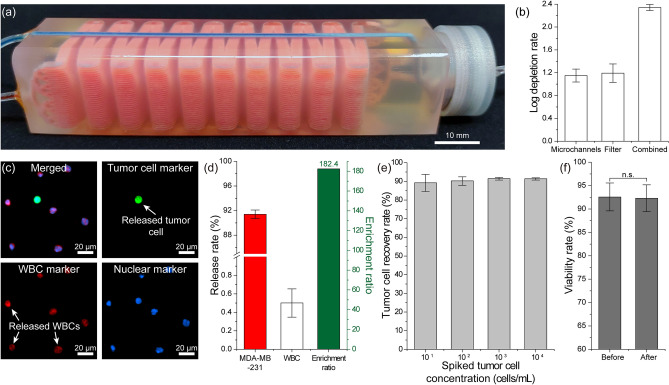
Characterization of the full device with simulated blood samples. (a) Photo of the final device with the PDMS membrane filter inserted in the filter compartment. The leukodepletion channels and the washing buffer channel were filled with a red and blue dye, respectively, to illustrate the device geometry. (b) Measured WBC log depletion rates in the leukodepletion channels, on the membrane filter, and the combined immunocapture rate for the whole device. (c) Fluorescence microscope images of the released cells in suspension. (d) Measured (left axis) release rates for the spiked tumor cells and WBCs, and (right axis) the enrichment ratio calculated based on these release rates. (e) Measured recovery rates of tumor cells spiked at different concentrations into blood samples. Tumor cell concentrations ranging from 101 to 104 cells/mL of blood were tested. A mean tumor cell recovery rate of ~ 90% was observed for all tested concentrations. The error bars represent standard deviations. (f) Measured tumor cell viability rates before and after processing through microfluidic device. Statistical significance was tested by performing Mann–Whitney U-tests; the difference between these two conditions was found to be not statistically significant.

