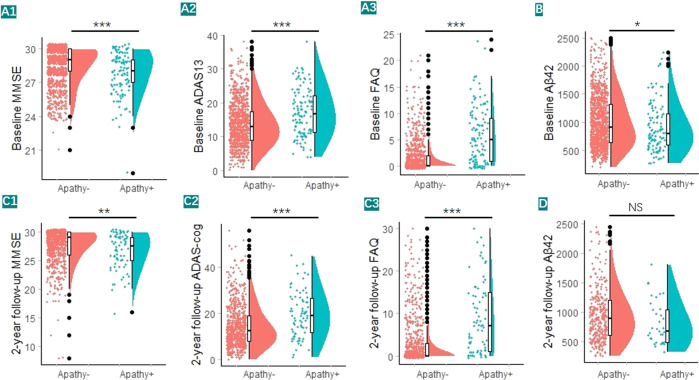
Fig. 1. Associations of apathy with clinical outcomes, including cognitive functions, quality life, and CSF Aβ42 level.
We categorized the total sample into apathy− subgroup and apathy+ subgroup. A1, A2, C1, C2 Lower cognitive functions were significant in apathy+ individuals than their normal counterparts. A3, C3 Lower quality of life were significant in apathy+ individuals. B, D Higher CSF Aβ42 (low statistical power) were significant in apathy+ individuals. Dots represented individuals’ clinical outcomes, with violin plots showing their median values and distributions. *p < 0.05, ***p < 0.001.

