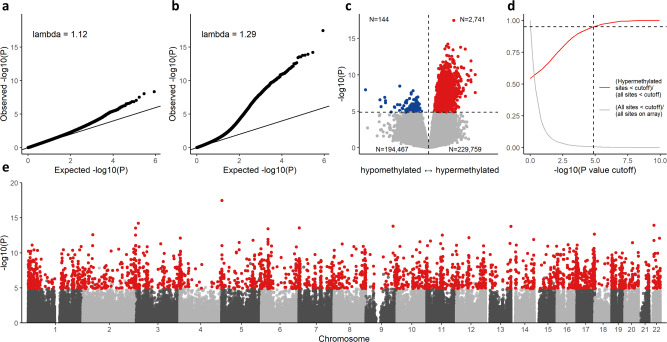
Fig. 1. Epigenome-wide association studies of DNMT3A and TET2 mutations.
a QQ plot the P value distribution in differential methylation analyses by DNMT3A mutation status (55 DNMT3A-mutated inviduals compared to 189 individuals without CHIP). b Same as A, but comparing 44 TET2-mutated individuals to 189 without CHIP. c Volcano plot of results from TET2-specific analyses. Horizontal dashed line indicates P = 1.4 × 10⁻⁵. Numbers in corners indicate the number of CpG sites in each quadrant separated by dashed lines. Red and blue dots represent hyper- and hypomethylated CpG sites, respectively, below the significance threshold. d Selection of P value cutoff used in C. Red line displays the increasing proportion of hypermethylated sites with decreasing P value cutoff. Horizontal dashed line indicates 95% of sites are hypermethylated. Vertical dashed line indicates selected P cutoff of 1.4 × 10⁻⁵. e Manhattan plot with the 2741 CpG sites showing TET2 mutation-associated hypermethylation highlighted in red. P values and effect size estimates in all panels derived using a linear mixed effects regression with twin pair as random intercept. All P values are two-sided and not adjusted for multiple comparisons.

