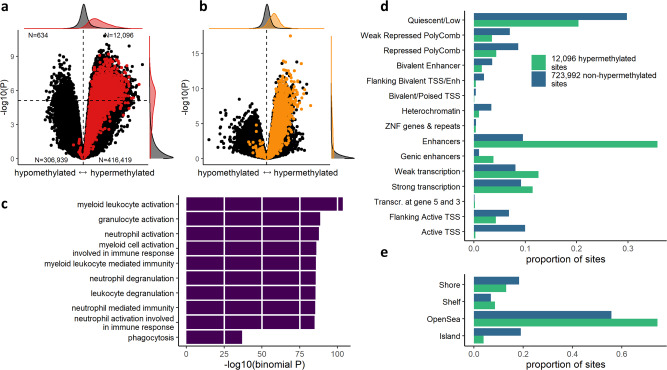
Fig. 3. Results of epigenome-wide analyses of TET2 mutations in granulocyte DNA from five CCUS patients and eight healthy controls.
a Volcano plot of CCUS results. Red dots indicate CpG sites from the set of 2741 hypermethylated sites in CHIP (Fig. 1c). Margins display distributions of the 2741 sites versus the rest of the EPIC array. Numbers in corners indicate the number of dots (both colors) in each quadrant separated by dashed lines. P values and effect size estimates derived using a linear model in Limma. P values are two-sided and not adjusted for multiple comparisons. b Volcano plot of CHIP results (same as 1C), yellow dots indicate CpG sites from the set of 12,096 significantly hypermethylated sites in CCUS granulocytes (upper right quadrant in panel a). Only sites analyzed in both CHIP and CCUS are shown. P values and effect size estimates derived using a linear model in Limma. P values are two-sided and not adjusted for multiple comparisons. c Enrichment of Gene Ontology terms for 12,096 hypermethylated sites in CCUS. P values derived using the region-based binomial test in GREAT and are not adjusted for multiple comparisong. d Monocyte chromatin states for hypermethylated and non-hypermethylated sites. e CpG island relations for hypermethylated and non-hypermethylated sites.

