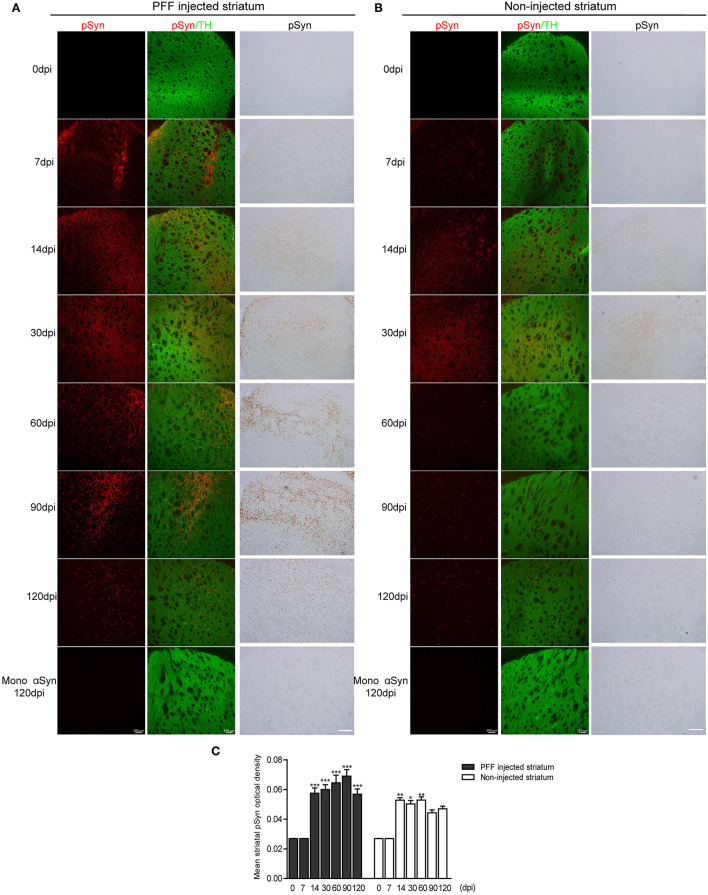
Figure 2.
The temporal accumulation of pathological αSyn in the striatum following unilateral striatal PFF injection. (A,B) Representative images of pSyn inclusions in the striatum at different time points. Confocal images showing double immunostaining of pSyn (red) and tyrosine hydroxylase (TH) (green) (left column), and 3,3′-diaminobenzidine (DAB) staining images of pSyn (right column) in the PFF or control- (monomeric αSyn) injected striatum (A) and noninjected striatum (B). (C) The mean striatal pSyn optical density (OD) using DAB images was quantified (χ2 = 92.84, p < 0.0001, df = 13). Bars indicate SEM, n = 3–4/time point. Significance means the comparison of each time point to baseline (0 dpi) using post hoc analysis (the Kruskal–Wallis test, *p < 0.05, **p < 0.01, ***p < 0.001). Scale bar, 100 μm.

