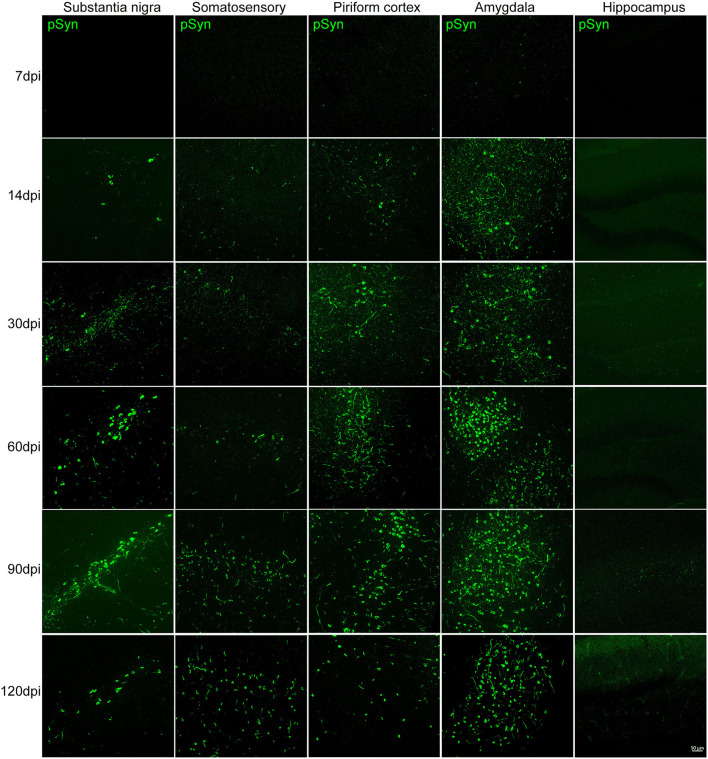
Figure 3.
The accumulation of pathological αSyn in various brain regions at different time points. Representative images of αSyn inclusions in different brain areas at each time point in the PFF-injected side. Immunofluorescence analysis of αSyn (green) was performed in the substantia nigra (SN), somatosensory cortex, piriform cortex, amygdala, and hippocampus of PFF-injected mice at different inoculation time. Scale bar, 50 μm.

