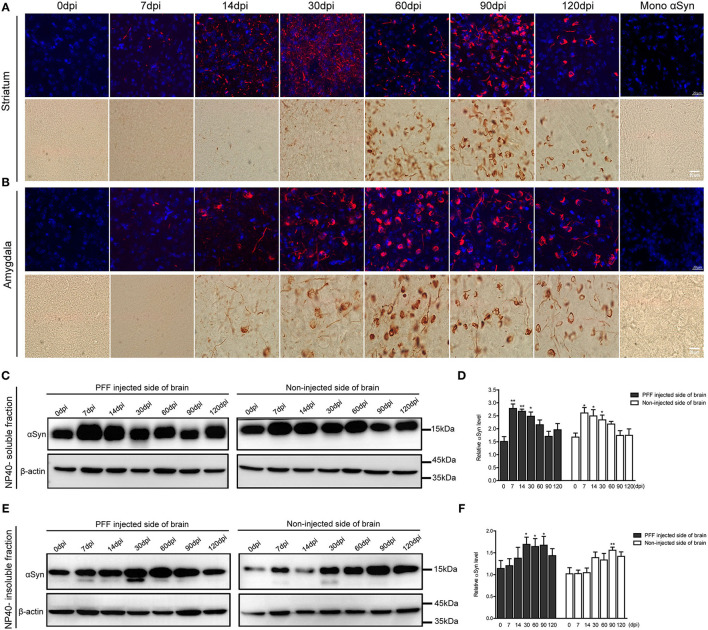
Figure 4.
Morphological changes of αSyn accumulation and the temporal change of αSyn contents in the brain of PFF-injected mice. (A,B) Phosphorylated αSyn positive inclusions changed their structures with time in the brain including striatum (A) and amygdala (B). Upper images showing the confocal images of pSyn (red) and 4′ 6-diamidino-2-phenylindole (DAPI) (blue) at different time points. Bottom images showing the detection of pSyn structures using DAB staining at each time point. Scale bar, 20 μm. (C–F) αSyn contents (antibody to αSyn monomer, ab212184) in the PFF-injected side of the whole brain and the noninjected side of the whole brain were evaluated in NP-40 soluble fraction (C,D) and insoluble fraction (E,F). (C,D) Soluble αSyn level showed a significant increment at an early time point and then decreased with time in a western blot (C) and its quantification (D) (χ2 = 40.66, p = 0.0001, df = 13). (E,F) αSyn level in NP-40 insoluble fraction increased in PFF-injected and noninjected sides (χ2 = 27.44, p = 0.0108, df = 13). Original blots are presented in Supplementary Figure 7. Bars indicate SEM, n = 4–5/time point. Statistical analysis was measured with the comparison of 0 dpi and each time point by post hoc analysis (the Kruskal–Wallis test, *p < 0.05, **p < 0.01).

