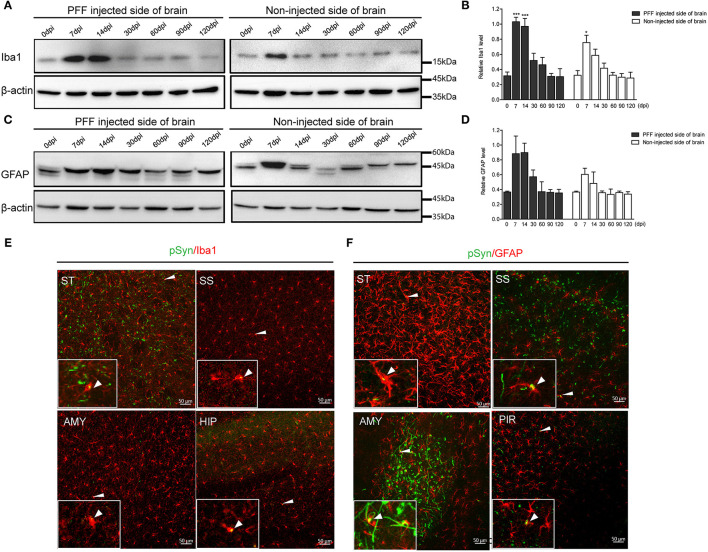
Figure 7.
The change of Iba1 and GFAP expression in the whole brain homogenate and the relationship of pSyn and inflammatory cells. (A,B) A representative immunoblot image (A) and its quantification (B) showing the level of Iba1 in the PFF-injected side of the brain and the noninjected side of the brain at each time point. Relative Iba1 level in the whole brain went up and then down significantly (χ2 = 69.63, p < 0.0001, df = 13). (C,D) Immunoblot (C) and quantification data (D) showed the level of GFAP in the PFF-injected and noninjected side of the brain increased and then decreased (χ2 = 16.47, p = 0.2246, df = 13). (E,F) Spatial relationship of inflammatory cells—microglia (E) and astrocytes (F)—and pSyn aggregation in various brain regions. Confocal images showing double immunostaining of pSyn (green) and Iba1 or GFAP (red) in PFF-injected mice. White arrows indicate the colocalization of pSyn and microglia or astrocytes. ST, SS, AMY, HIP, and PIR are striatum, somatosensory cortex, amygdala, hippocampus, and piriform cortex, respectively. Original blots are presented in Supplementary Figure 7. Bars indicate SEM, n = 4–5/time point. Statistical significance was measured with a comparison of 0 dpi and each time point by a post hoc analysis (the Kruskal–Wallis test, *p < 0.05, ***p < 0.001).

