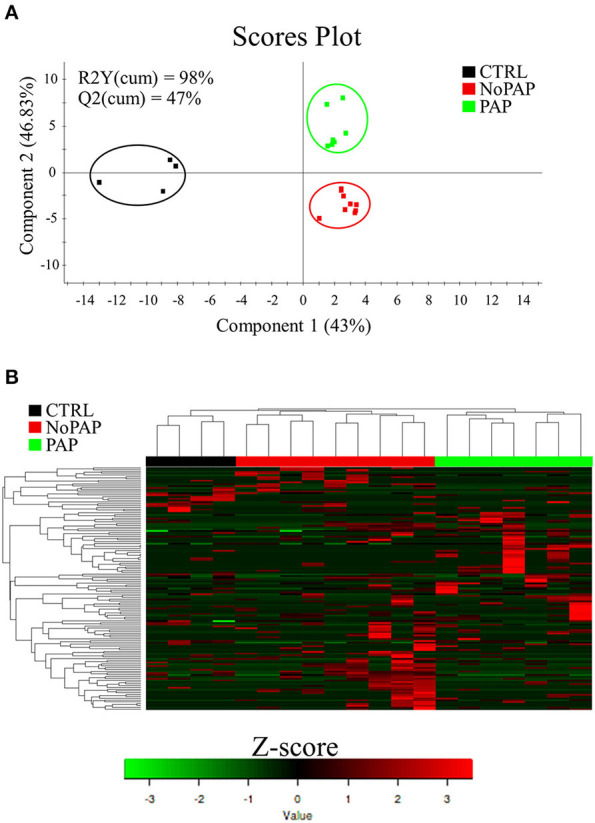
Figure 3.

(A) Two-dimensional partial least-squares discriminant analysis (PLS-DA) score plot constructed using the variable diet representing the distribution of the samples between the first two components in the model. The validation by permutation test can be found in Supplementary Figure 3. (B) Heatmap representing the abundance distribution (Z-score) of the OTUs identified to drive the separation by diet (VIP ≥ 1).
